
Transmission constraints in Great Britain
The Review of Electricity Market Arrangements (REMA), Connections Reform, Clean Power 2030 (CP30), and the Strategic Spatial Energy Plan (SSEP) are upcoming policy reforms.
All, in various ways, are trying to address significant and growing constraints in the GB power market due to limited transmission infrastructure and inefficiencies in the current market, as well as enabling the transition to net zero and away from reliance on Russian gas.
Here, we describe how transmission constraints are handled in the GB battery revenue forecast. It is based on current market structures in the Balancing Mechanism.
Network constraints are becoming more severe and highly locational
Many TWh of new-build generation will come online over the next 25 years and with that, a build-out of HV wires in the transmission network to carry the power generated.
Despite planned upgrades to the transmission system, there will be a limited amount of copper cable to transport power from where it is generated to where it is used. Most of the huge wind buildout is (and will be) in the North of Great Britain, whereas demand is concentrated in the South.
Flexible plants will be required to balance out supply and demand on each side of each major boundary.
Modelling the future network
Upgrades to the transmission system to support this growth in supply and demand are based on data from the Electricity Ten Year Statement. It provides anticipated constraint levels across each boundary in future years to answer "how much of the time will <x> boundary be constrained"?
The capacity of flexible technologies (ie thermal plants and energy storage) to respond to imbalances across each boundary is taken from the techno-economic capacity build-out with the forecast. This is then split by region according to DUKES (which describes transmission-connected assets) and the Regional Future Energy Scenarios (for those connected at the distribution level).
We model volumes of energy that need to be balanced, both for system reasons (e.g., constraints) and for energy reasons (e.g., differences in supply and demand) out to 2050.
GB transmission constraints: 2024 to 2033 and beyond
Anticipated transmission constraints are shown below, with commentary on what drives them.

High levels of wind generation in Scotland need to move across the border towards demand centres in England. In 2024, the largest constraint in Great Britain was the B6 constraint with similar levels on the B7a. Both boundaries can be simultaneously resolved with bids North of the B6 and offers South of the B7a.
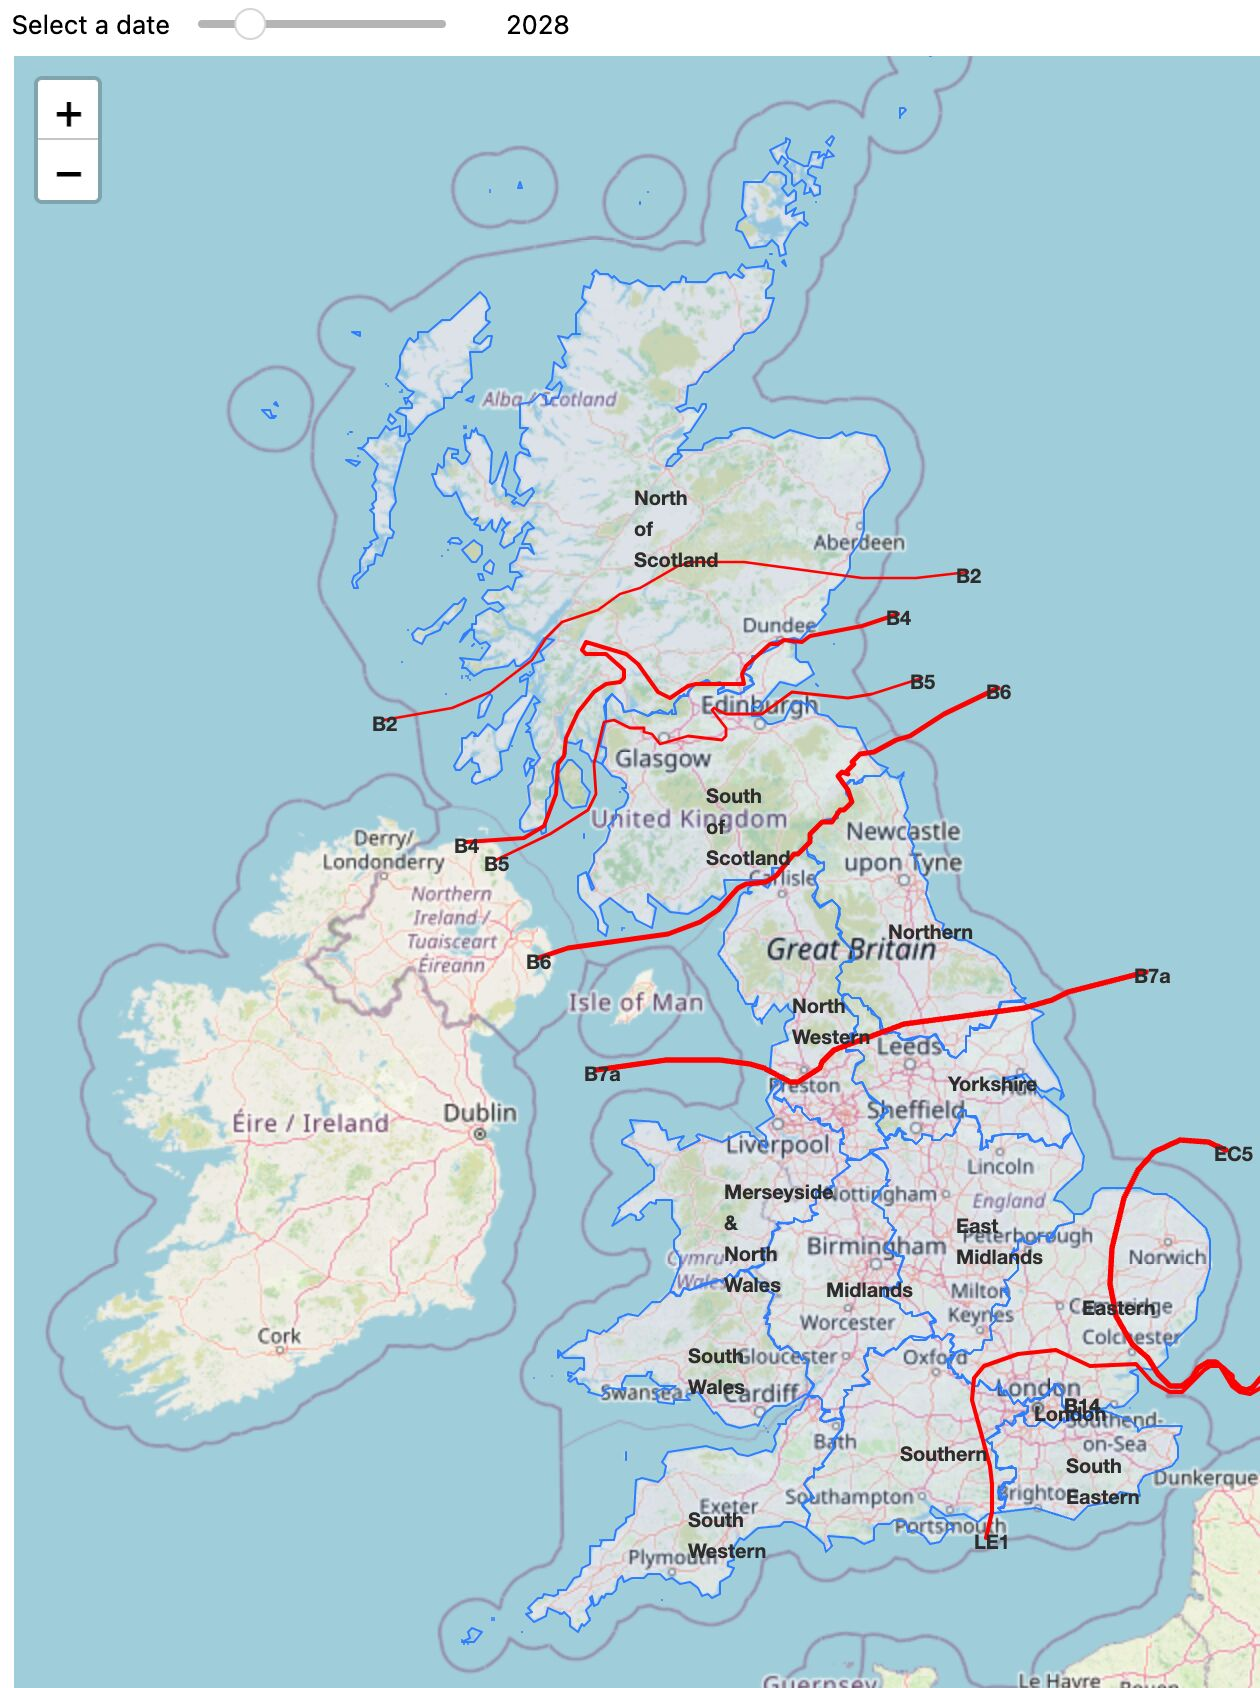
By 2028, there will be more constraints in Scotland as well as in the East of England (due to wind generation) and the South East of England (due to interconnectors and high levels of demand). There will then be considerable constraints further North in Scotland than the B6 which bids north of the B2 boundary would ease.

By 2033, transmission improvements will mean the situation returns to a similar situation to today, with the B6 once again being the dominant constraint.
We have made adjustments to the Electricity Ten Year Statement data in later years as it would otherwise lead to unrealistically high constraints in Scotland, particularly at the B2 boundary. In reality, the cost of building more transmission in the area would be cheaper than the cost of balancing the system, so we have increased the assumed level of transmission capability in Northern Scotland.
In the constraint modelling, do you assume any future outages on the transmission network?
The actual performance of the boundaries we model is not 100%.
While we don't explicitly model outages, we account for them implicitly by using historic data to calibrate the model.
The Electricity Ten Year Statement is used to work out what flows we expect across each boundary for every half-hour period. This is compared with the theoretical capability of each boundary to calculate how constrained the boundary will be.
A mapping is then used to get from how constrained the boundary is to the BM volumes needed to address that constraint. The mapping is based on looking historically at the relationship between the theoretical capability of the B6 and the BM volumes needed to address B6 constraints. The B6 is not always operating at full capability, so this model accounts for outages.
In doing this, we assume:
- Outages on all boundaries are similar to what the B6 has had over the last couple of years.
- The relationship between the constraint level of a boundary and the BM volumes needed to address it is the same for each boundary.
This might not be the case, but the fact the B6 is currently the only significant constraint makes it impossible to do anything different.
Updated 8 months ago