
Renewable load factors
It's all very well having an installed capacity, but the sun and wind are intermittent. And they massively impact power prices. What do we do to forecast actual generation?
We use historical wind and solar load factors from Renewables Ninja to project forward wind and solar generation.
A load factor describes how much energy is generated given the installed capacity of a generator.If it is very windy for 50% of the year (and not at all the rest of the year), a 100MW wind farm might generate with a 50% load factor. Over the course of a year, it will generate
100 MW 365 days 24 hours * 50% load factor = 438,000 MWh or 438 GWh.Actual wind load factors are more like 40% for offshore wind, 28% for onshore wind, and 11% for solar.
Forecasting wind
We use a half-hourly wind load factor from 2018 as a seed (from Renewables Ninja) and adjust it to reflect a seasonal normal wind year using DUKES data (1996-2019).
For each half-hour period across the forecast horizon, we replicate this 2018 load factor (so that Jan 1st 2023 looks like Jan 1st 2018 and Jan 1st 2049). This ensures appropriate wind variation across the year, and volatility in wind generation across a day. We then multiply that historic 2018 load factor (which changes each 30 minutes) by a scale factor to take it to a 'seasonal normal' wind year in the future.
The scaling takes the Renewables Ninja data to DUKES, which we then scale up to get appropriate values for 2023 and beyond, following increasing renewable capture rates (see below).
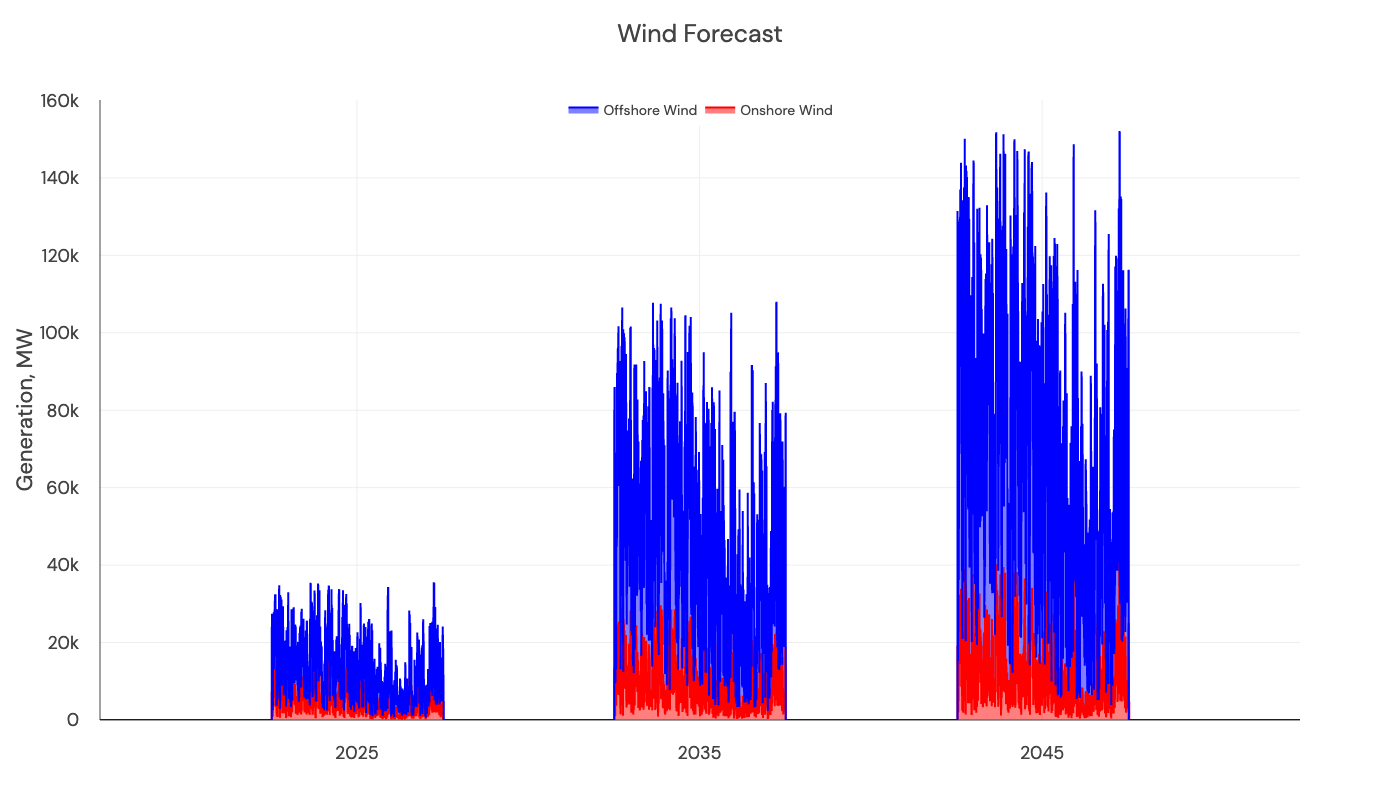
We then multiply this scaled load factor by the projected installed capacity in that year, to produce a generated MW for onshore and offshore per half-hour from 2023 to 2050.
An example for one day (27th August) of this process:
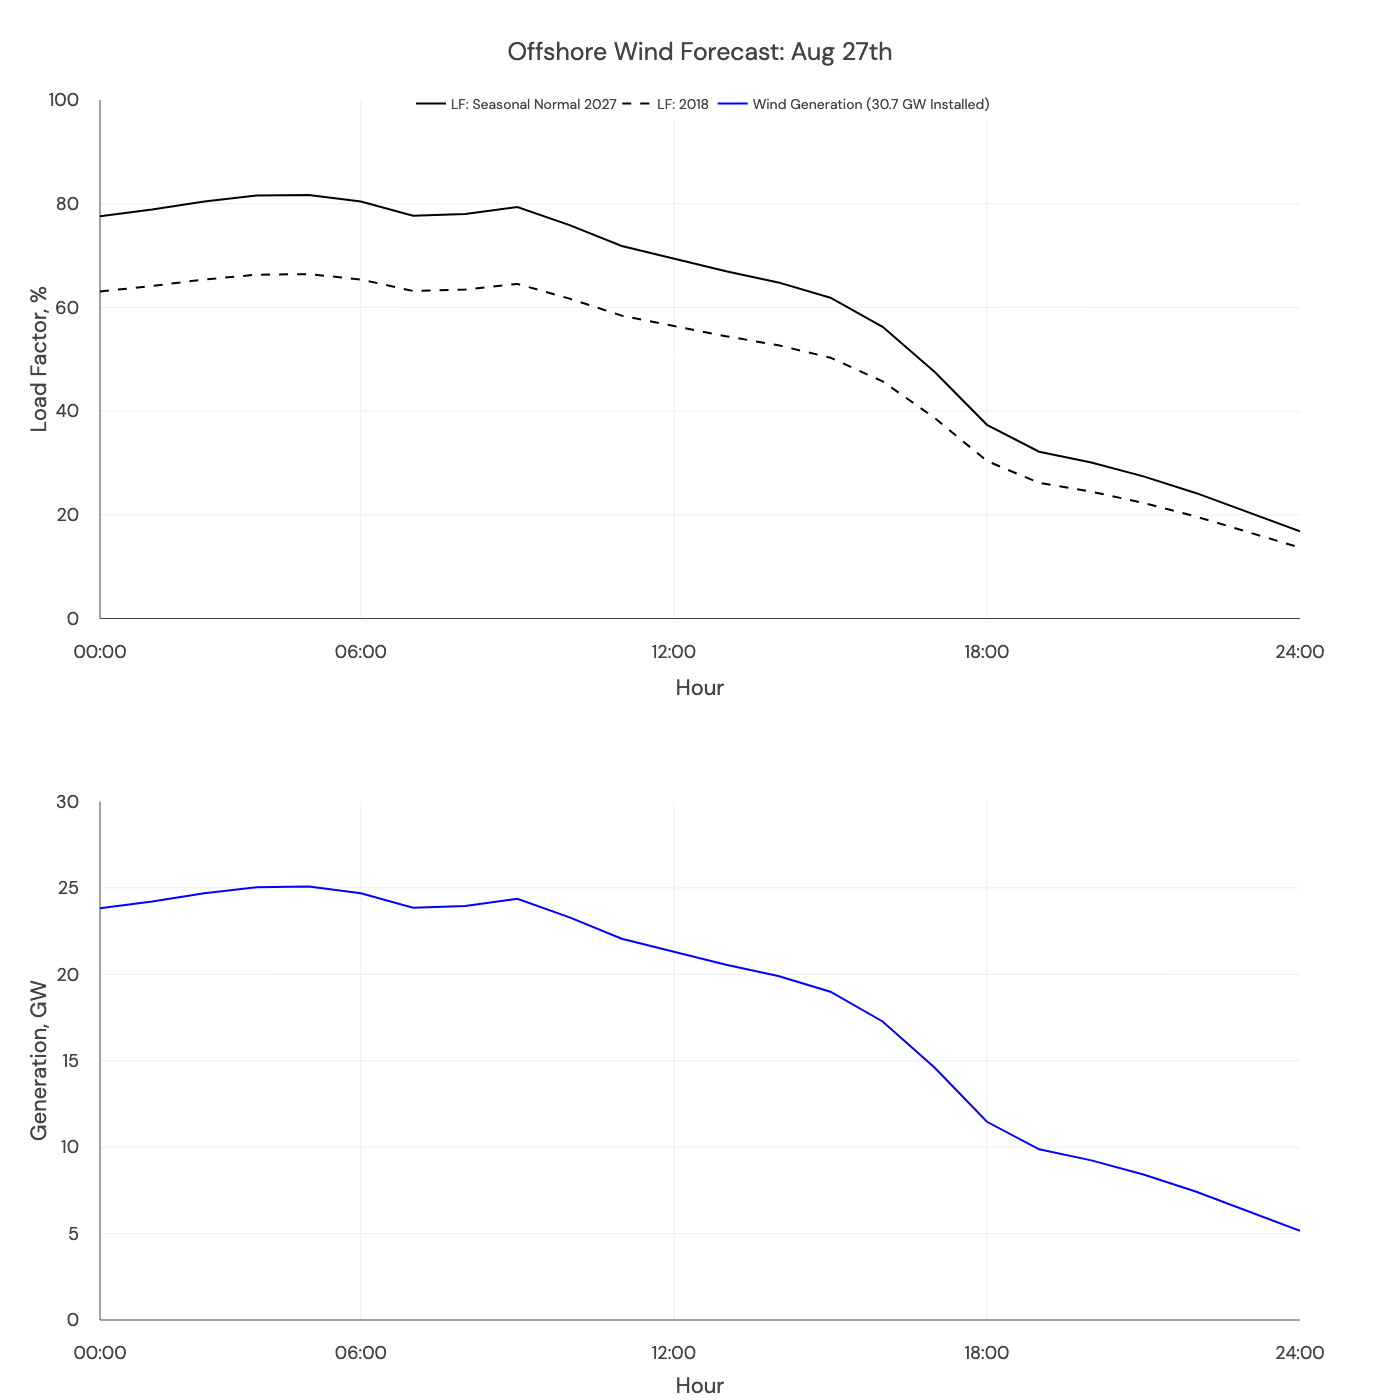
If, during an individual half-hour the scaling makes the wind generation exceed 100% load factor, we cap it to 100%.
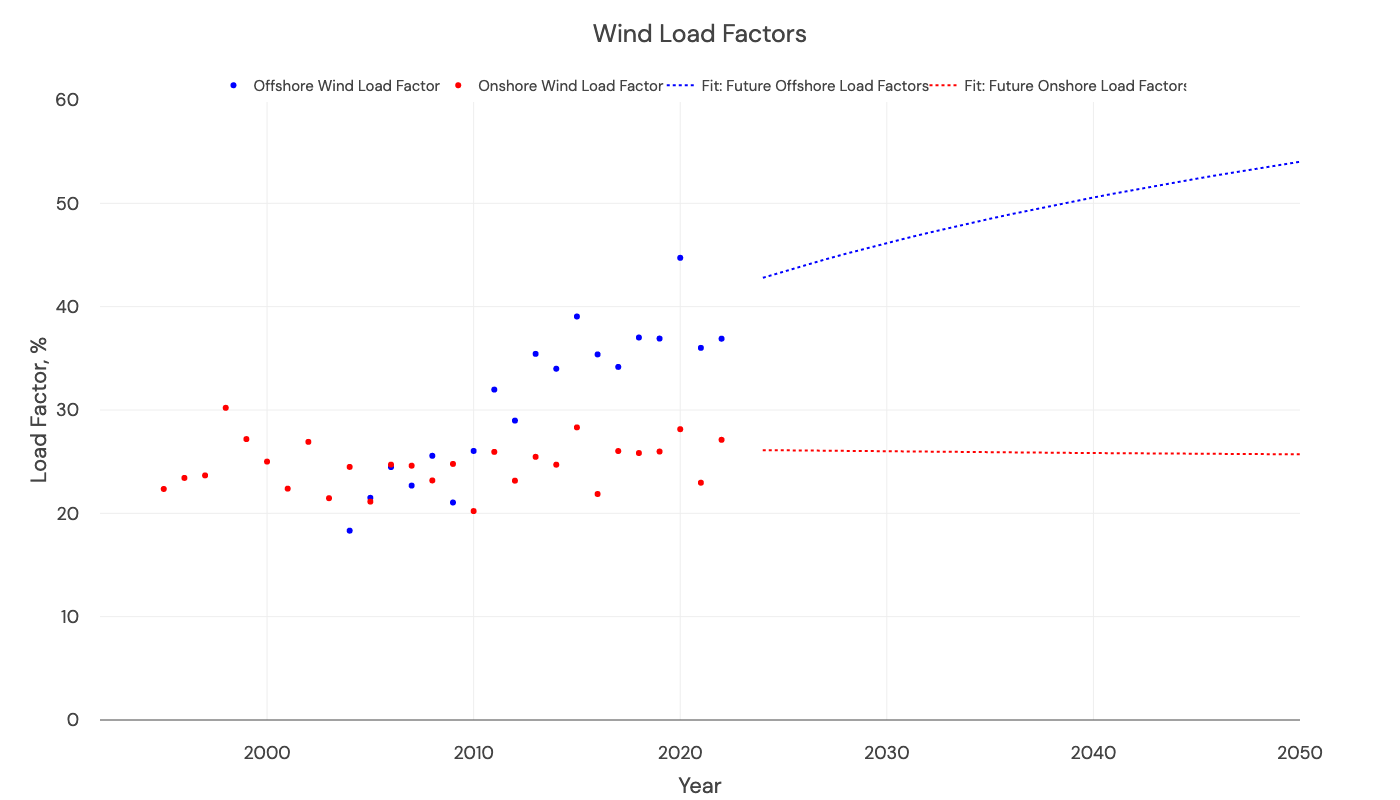
Offshore wind load factors are generally increasing; onshore are not
We observe increasing load factors year-on-year in historical data (from DUKES, see the graph below). Capture rates are increasing as we install larger wind turbines placed further out at sea (where it's windier), and the offshore fleet gets more geographic dispersion (when it's not windy in one place, it might be windy elsewhere). We expect this trend to continue as floating offshore wind and wind farms spread around UK waters (like the Celtic Sea).
We fit past behavior of load factors and push this forward to 2050. In 2050, we anticipate the average annual load factor for offshore wind to be 55%.
Offshore dominates going forward
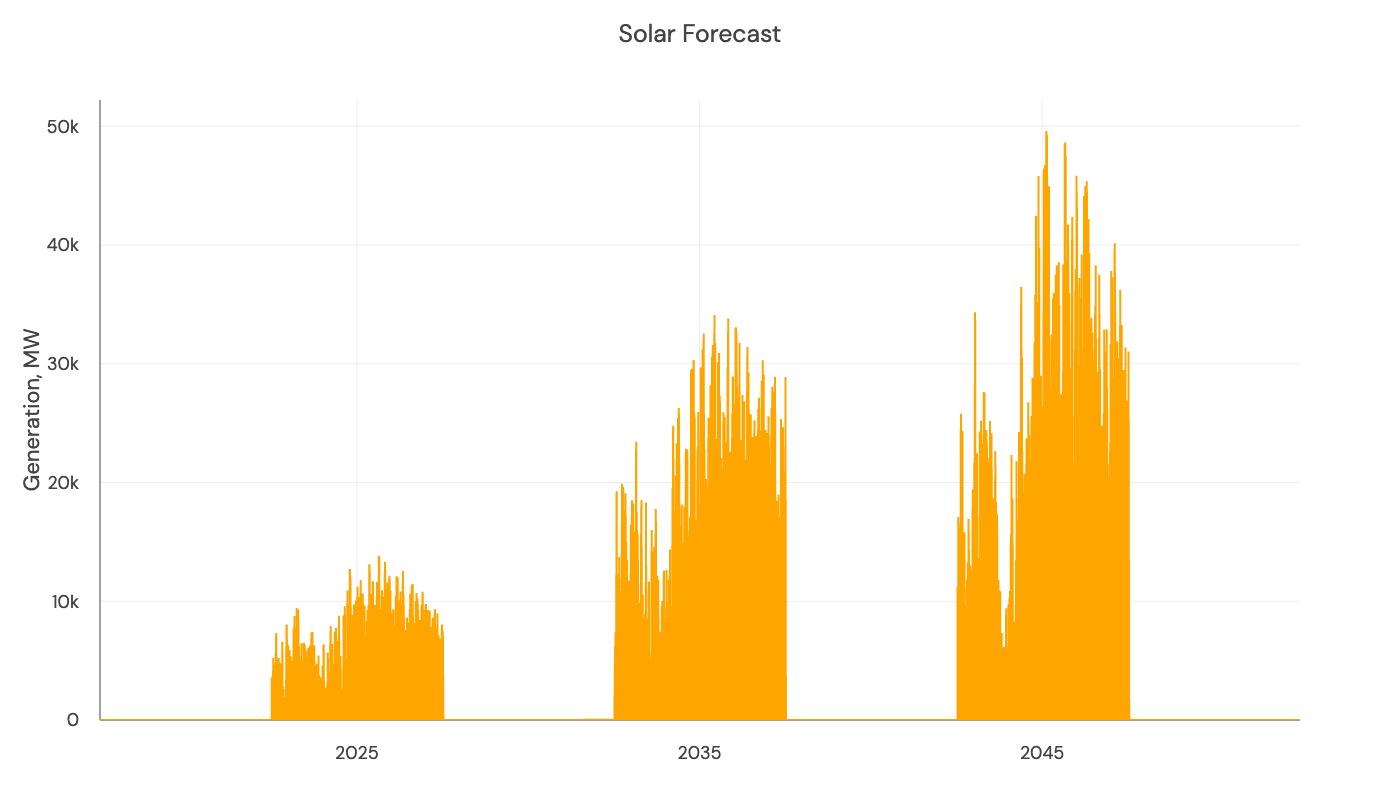
Forecasting solar
Solar is forecasted using Sheffield Solar data from 2018. This load factor is repeated in future years, and multiplied with the forward capacity to get forecast solar generation.
Updated 8 months ago