
Backtest
How does the model compare to reality, when we look at historic day-ahead prices?
Backtesting fundamentals model: day-ahead price
We compare a data point every half hour (our forecast) to a data point every hour (the N2EX day-ahead price). We take that hourly data point and forward fill to make two per hour so we can compare every forecasted data point.
We use historical data for some of the inputs
We normalize the model as much as possible - giving it real historical data and seeing what it generates. This allows us to compare our model to historical data and assess performance. We input:
- Daily SAP gas price
- Actual wind data
- Plant availability (via MEL data) for CCGTs and OCGTs
- Availability of interconnectors (max rolling 24h flows via BMRS data)
- Actual demand data (given by the sum of all generation, including embedded solar, waste and gas CHP)
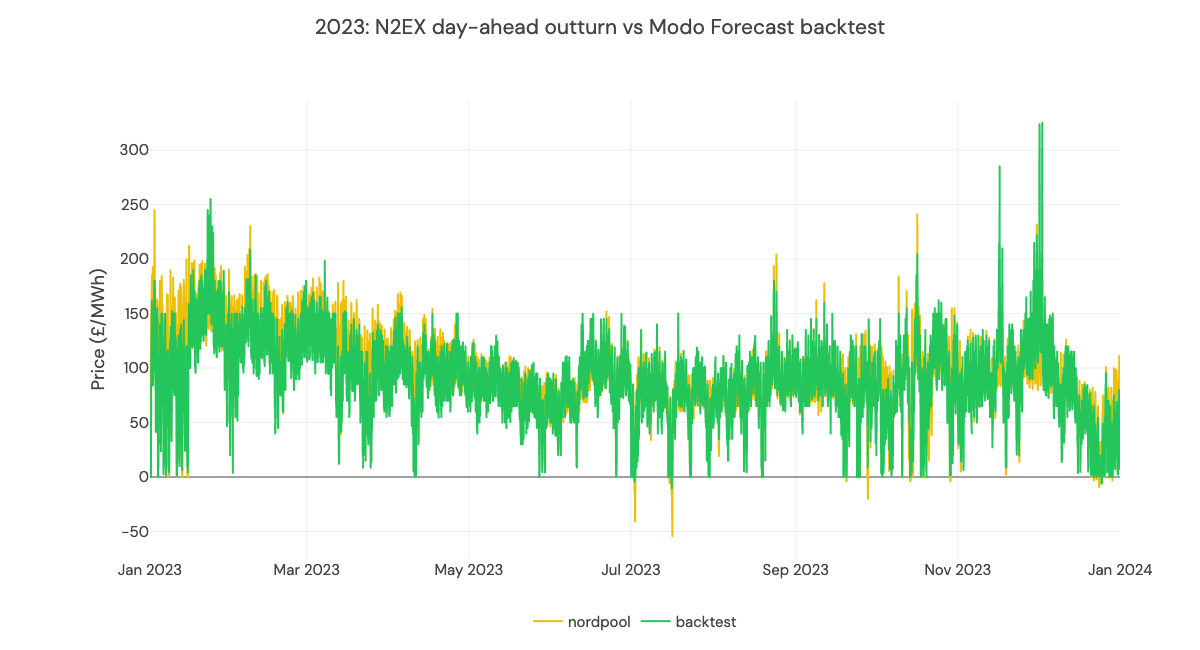
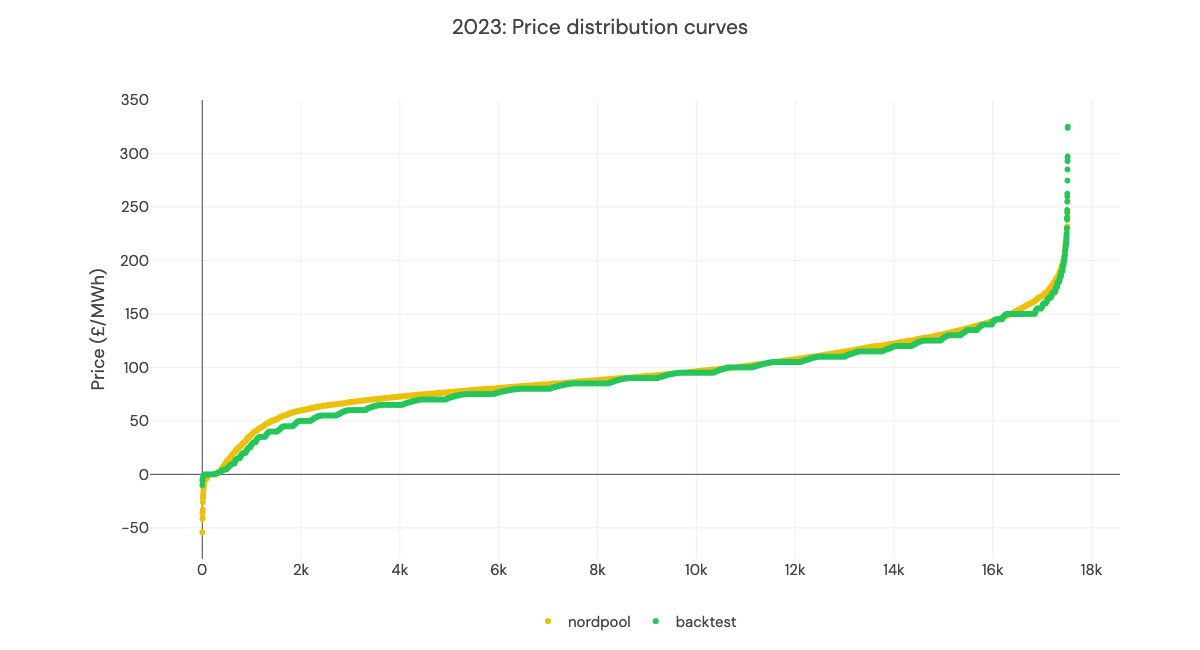
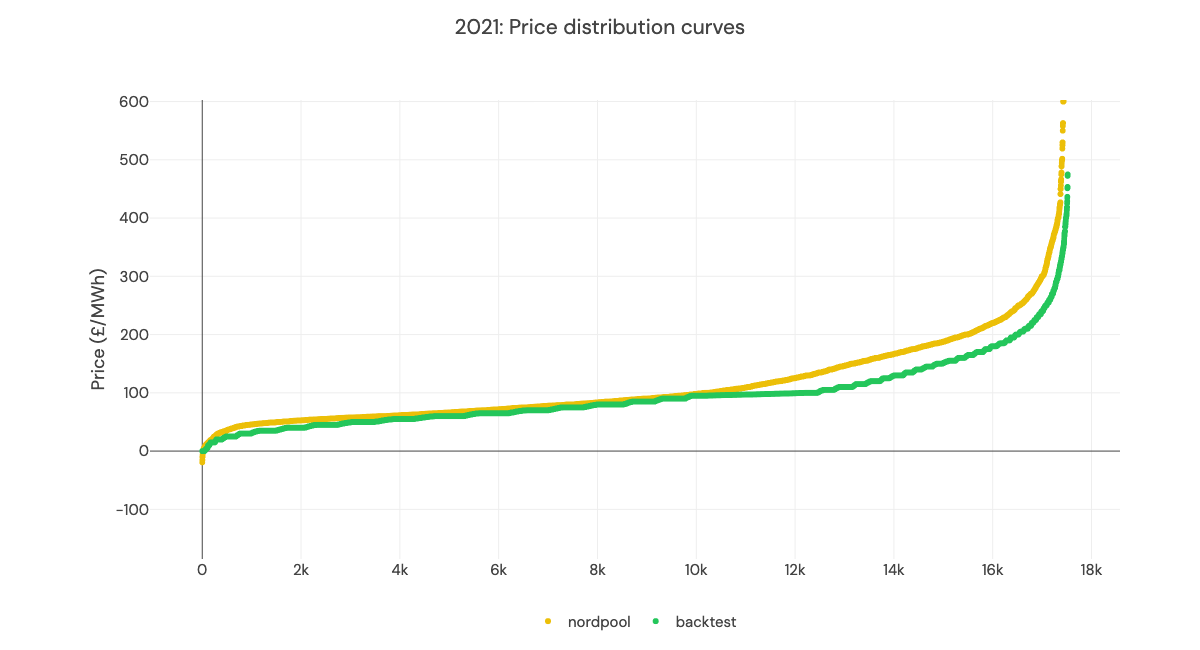
We compare our modeled power prices to Nordpool Day Ahead hourly prices for 2021-2023
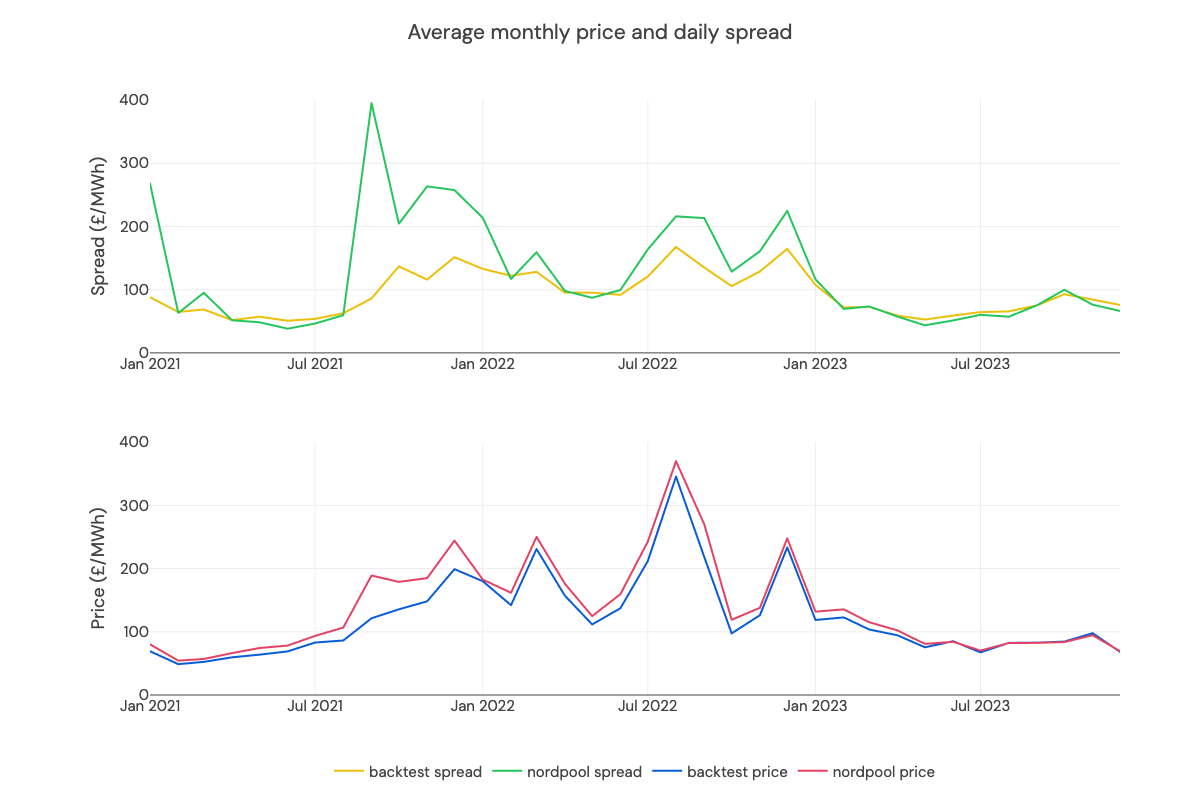
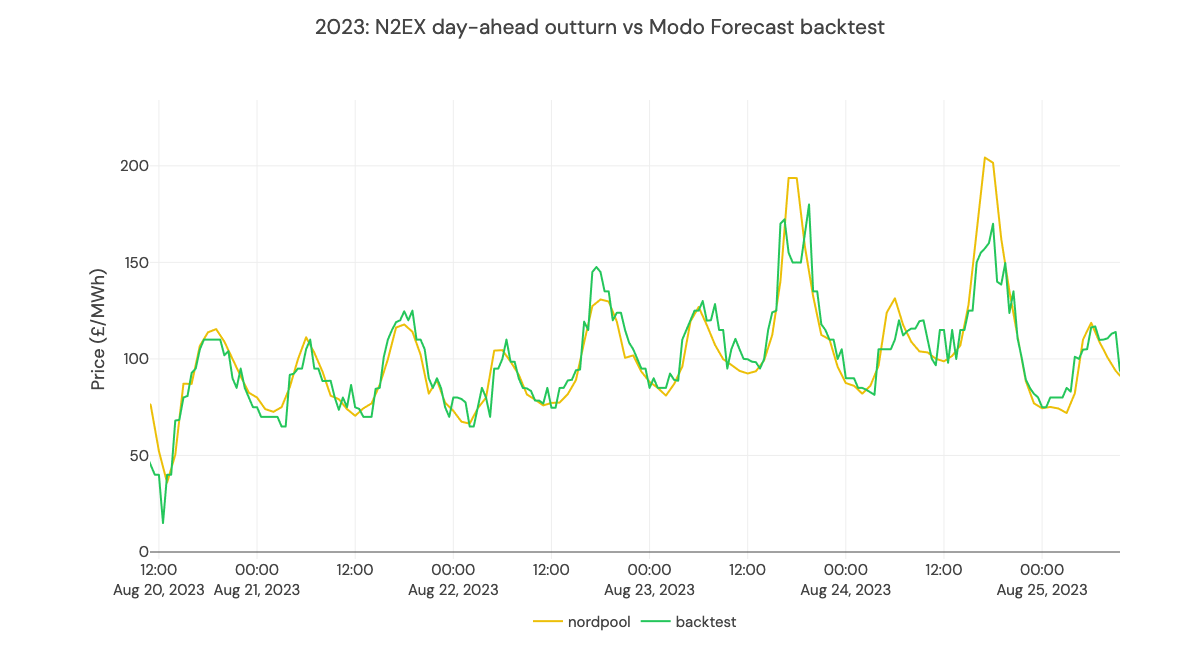
Post-gas crisis, in 2023, our model predicts prices pretty accurately. The root-mean squared error is 2.6x lower in 2023, compared to 2021-2022.
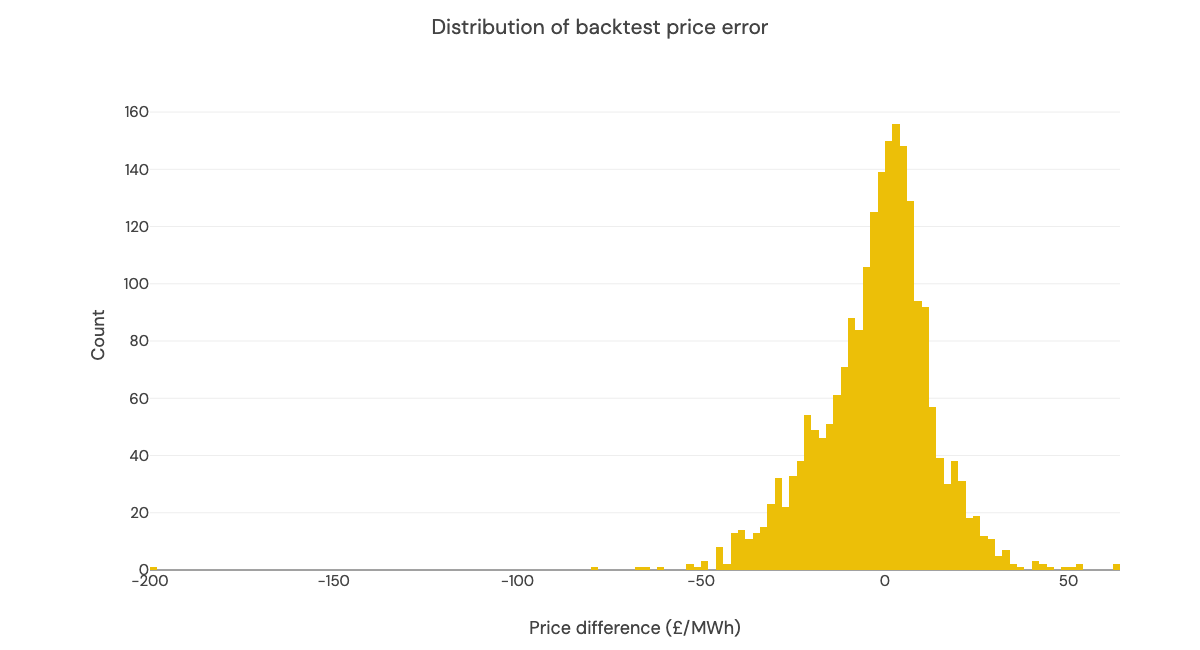
2023 backtest shows a mean error of £3.80/MWh
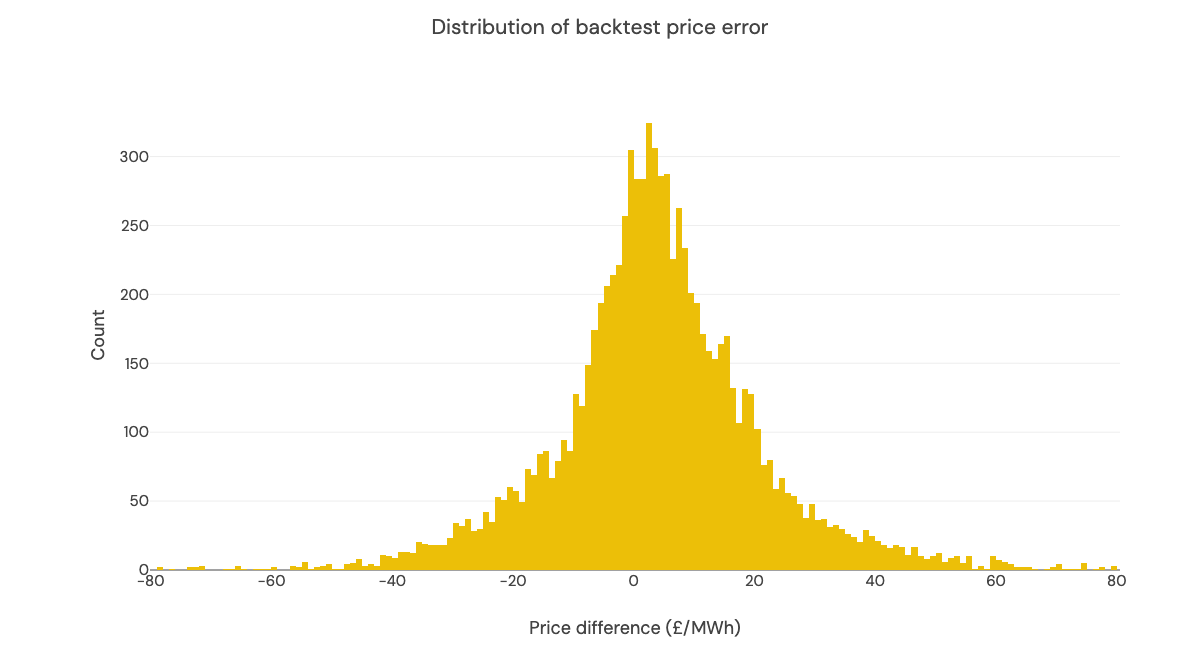
The mean of the error distribution is £3.80 - the backtest tends to underestimate prices. We found that the most expensive 20% of CCGT Bids and Offers are significantly above the average SRMC. For a few extreme weeks these were up to 5-6x higher. Our average fit might underestimate costs for such weeks.
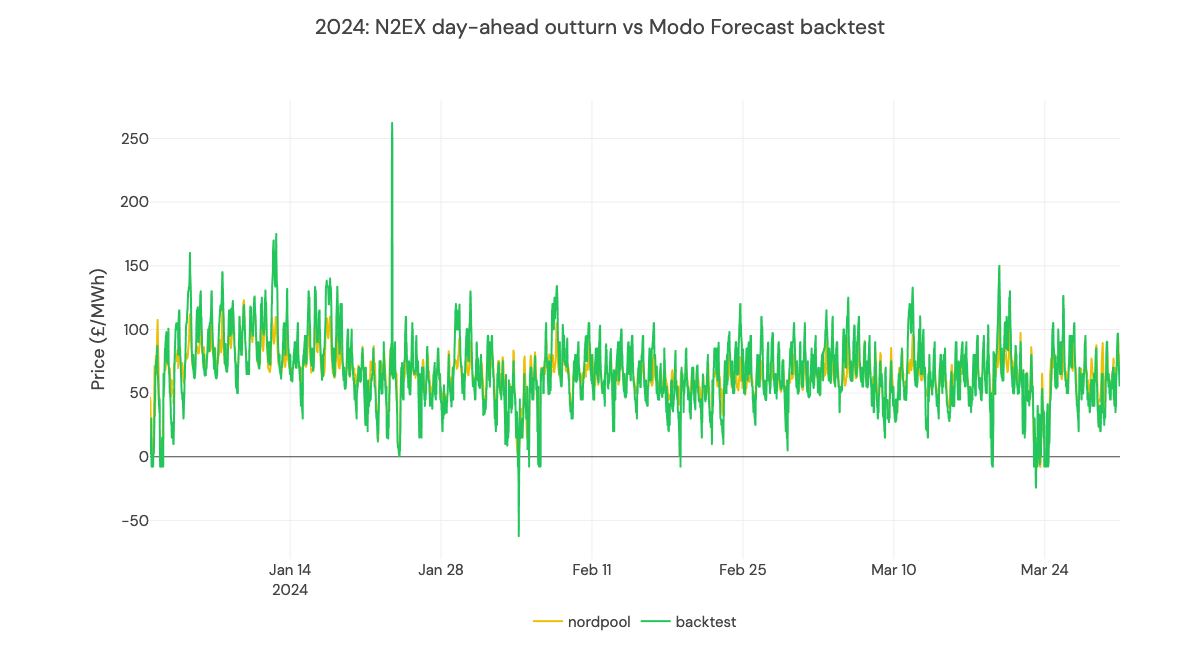
2024: record low prices in Q1
Q1 of 2024 saw record-low prices and spreads due to low peak demand, very high wind generation, and interconnector imports. Our model overpredicts the peak price on one day but otherwise captures the lower prices. Mean error is £-1.79/MWh and mean absolute error is £11.40/MWh.
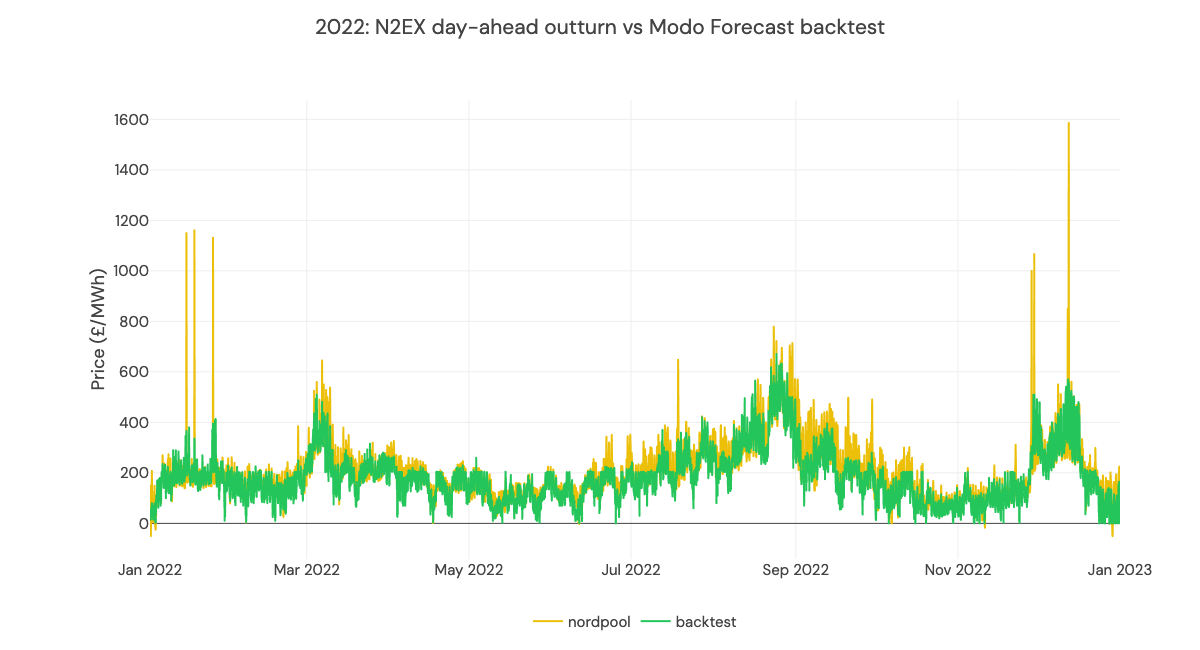
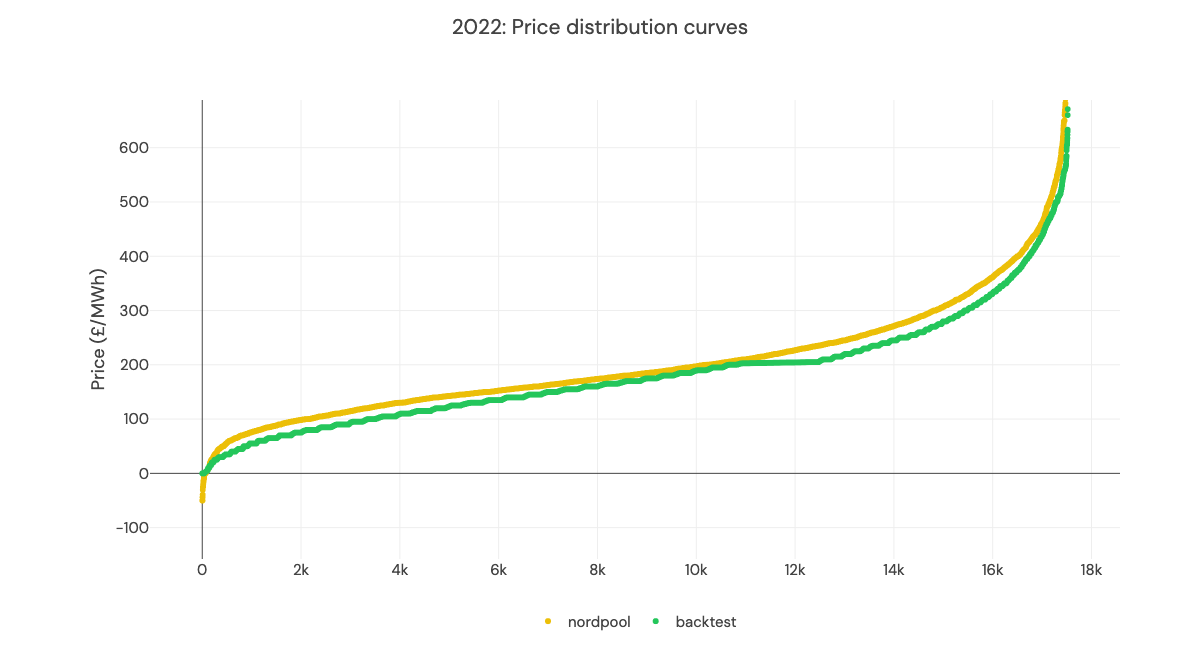
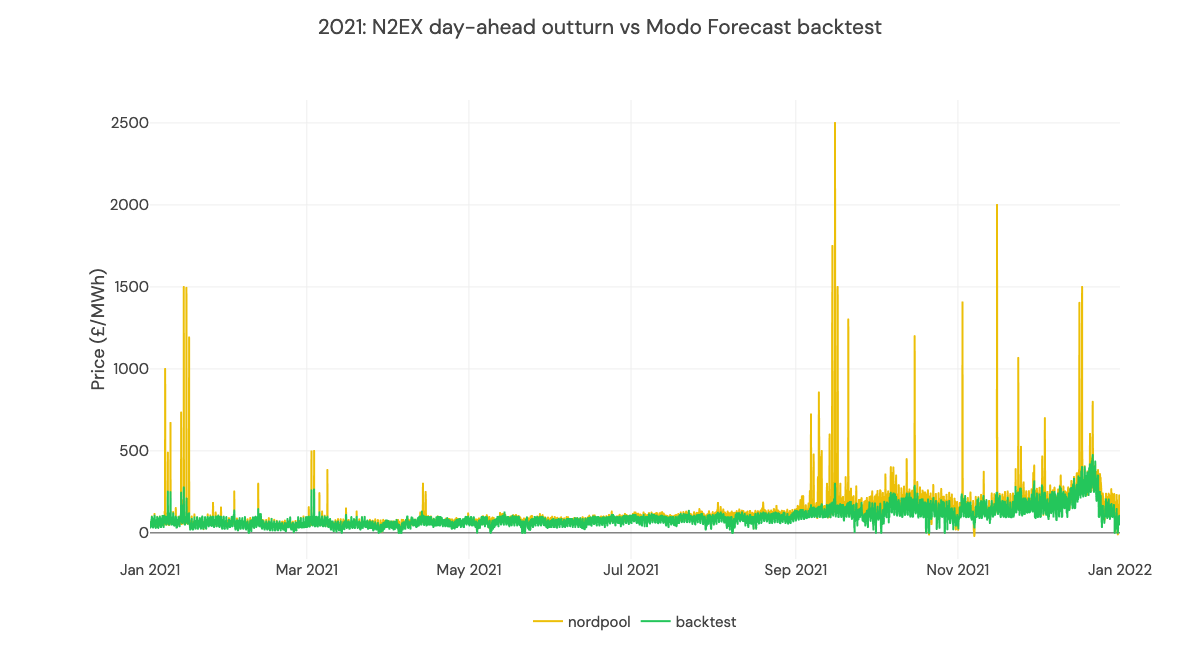
2022 and 2021: energy markets in crisis
Both 2021 and 2022 saw far more intraday volatility than our model predicts. There are a few reasons for this:
- The Russian invasion of Ukraine - and linked record high gas prices - added a significant risk premium to market operators.
- The gas and electricity markets were in contango (future markets were worth more than spot markets) - and peak power especially was over-valued.
- In periods of tightness, particularly over £500/MWh, a scarcity premium emerges in power markets.
- Considering these factors, a huge risk premium was priced into the market: this is not captured in our fundamentals model.
2021
What's setting these prices?
Below, we show the generation stack and marginal plant for a sample week, as predicted by the backtest (see here for more details on how we build generation stacks).
CCGTs usually set the price, they have variable prices and make up a large part of the stack. But when demand is low and renewable generation is high (as seen early on the 19th and 20th), the price is set by wind.
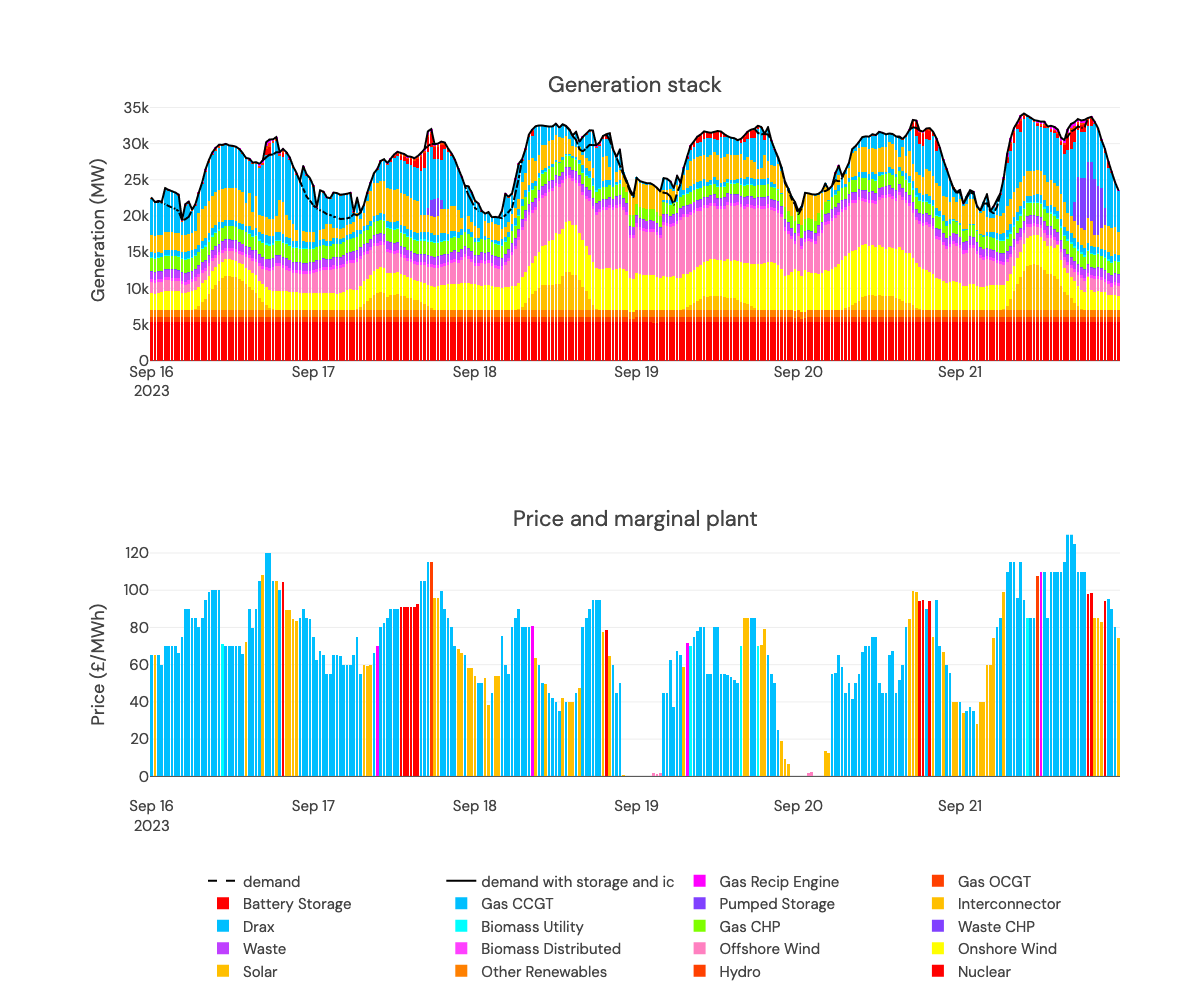
Wind sets the price when it is zero on Sept 19th and 20th!
Backtesting fundamentals model: intraday price
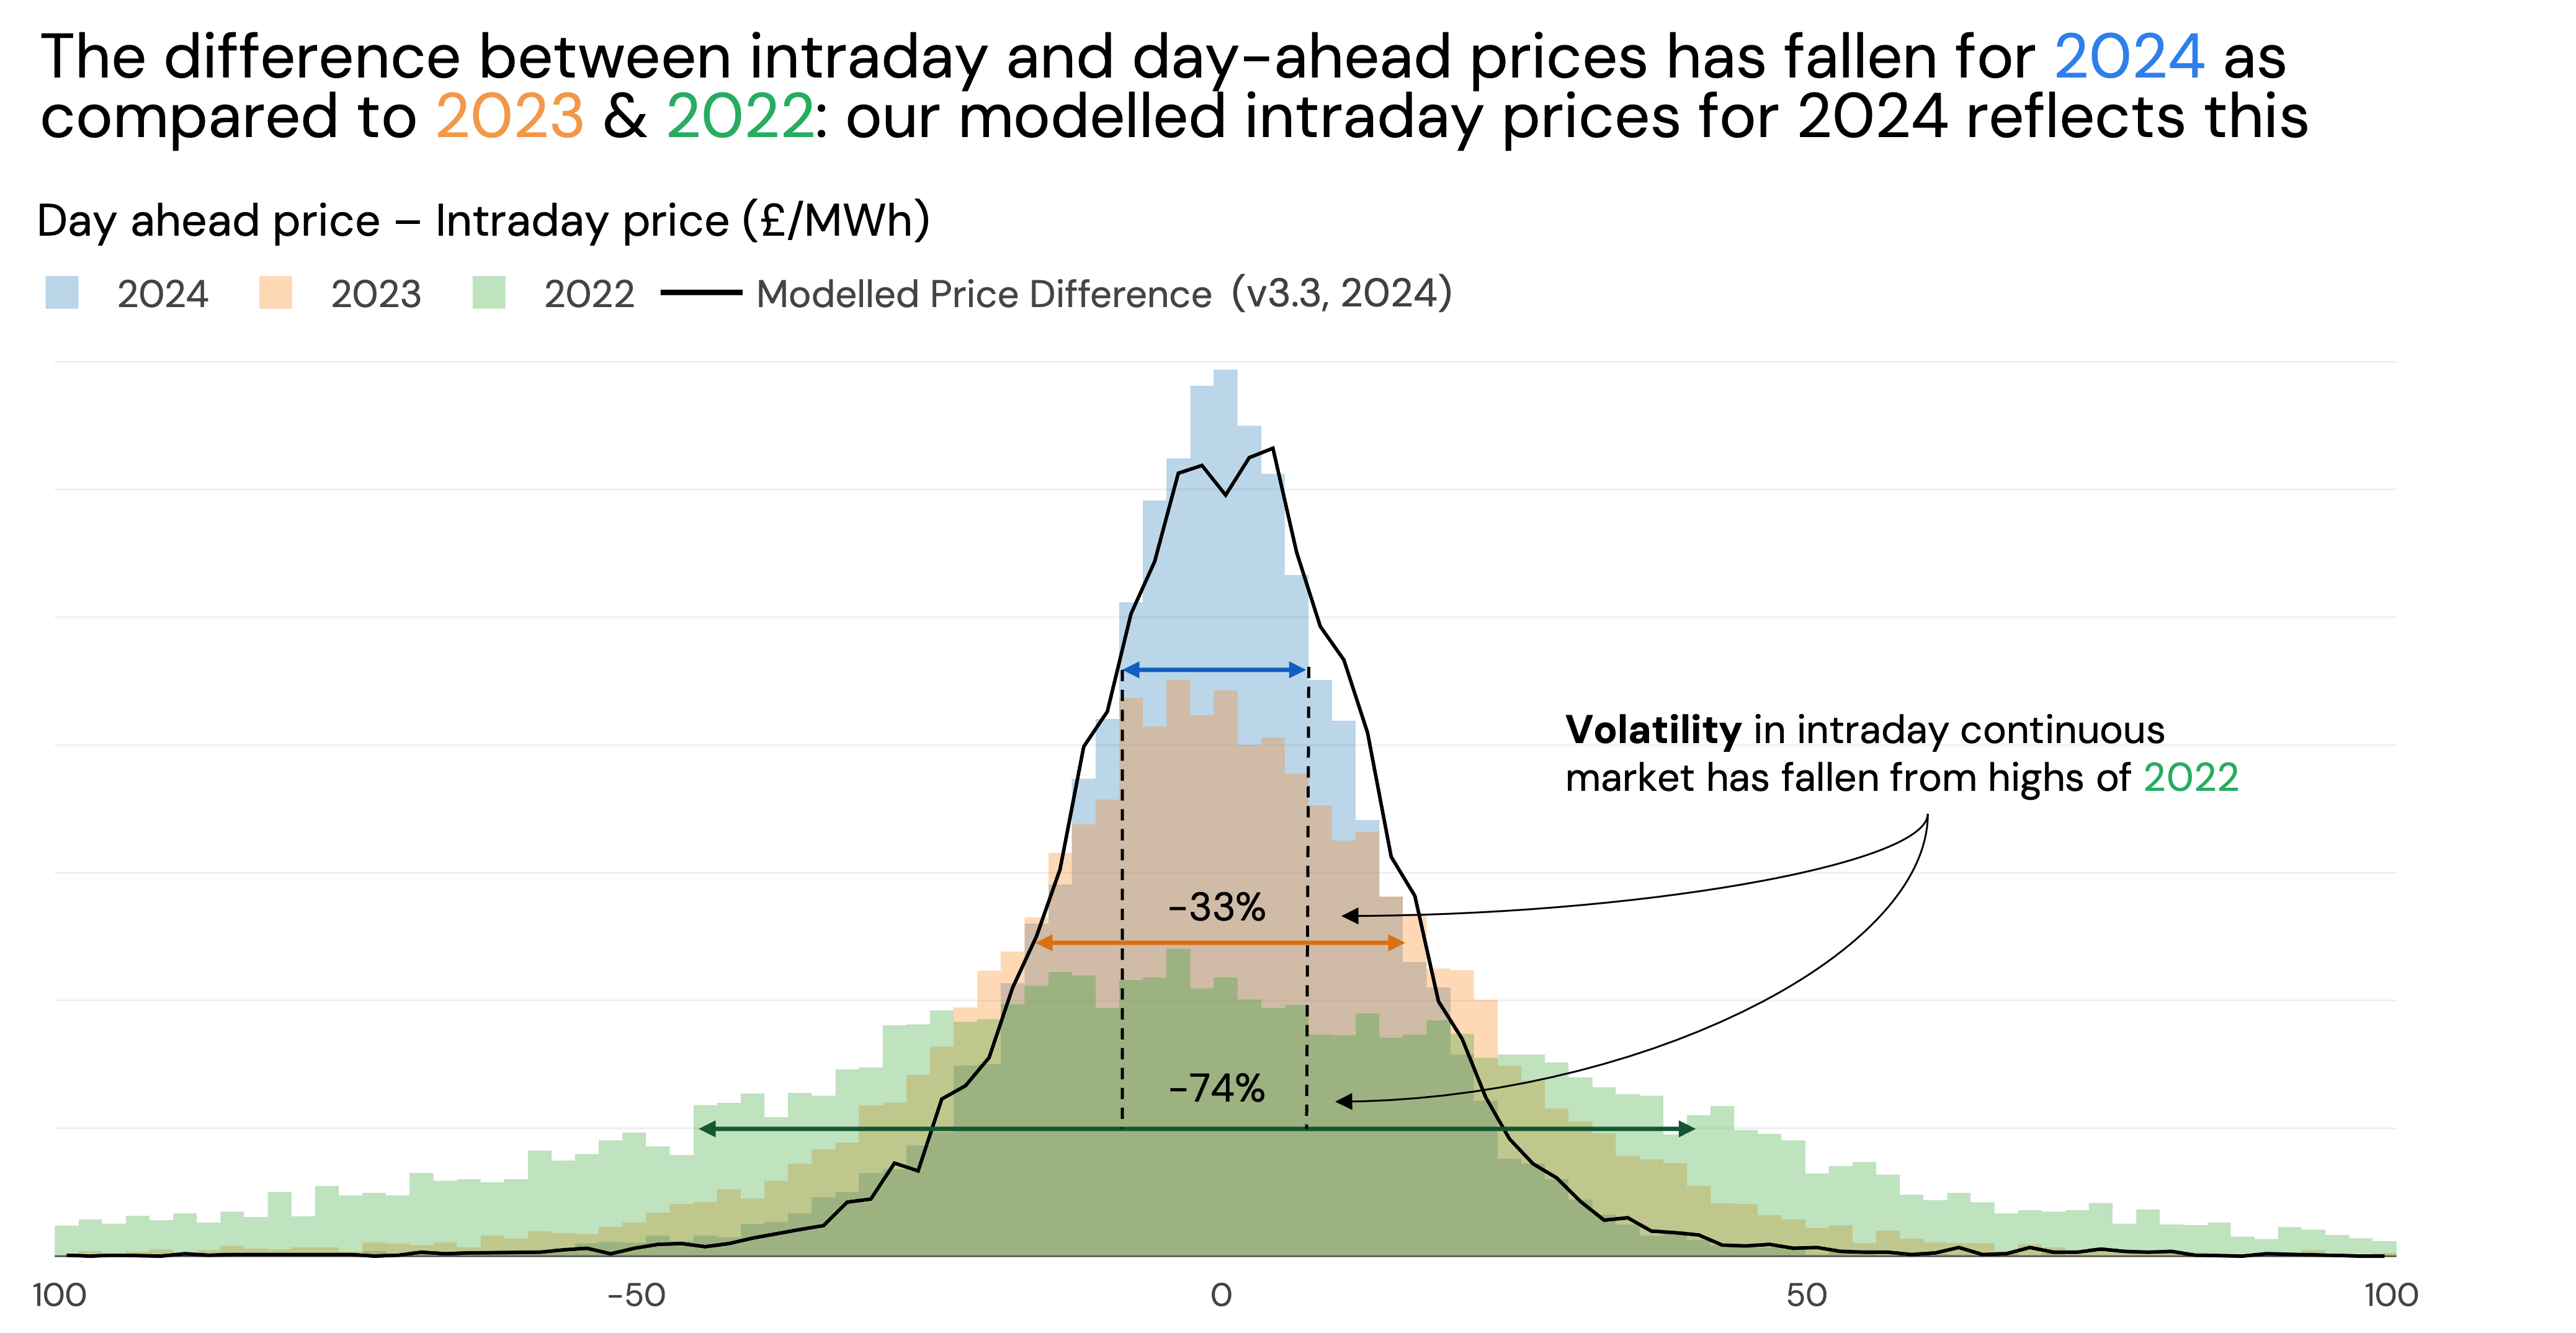
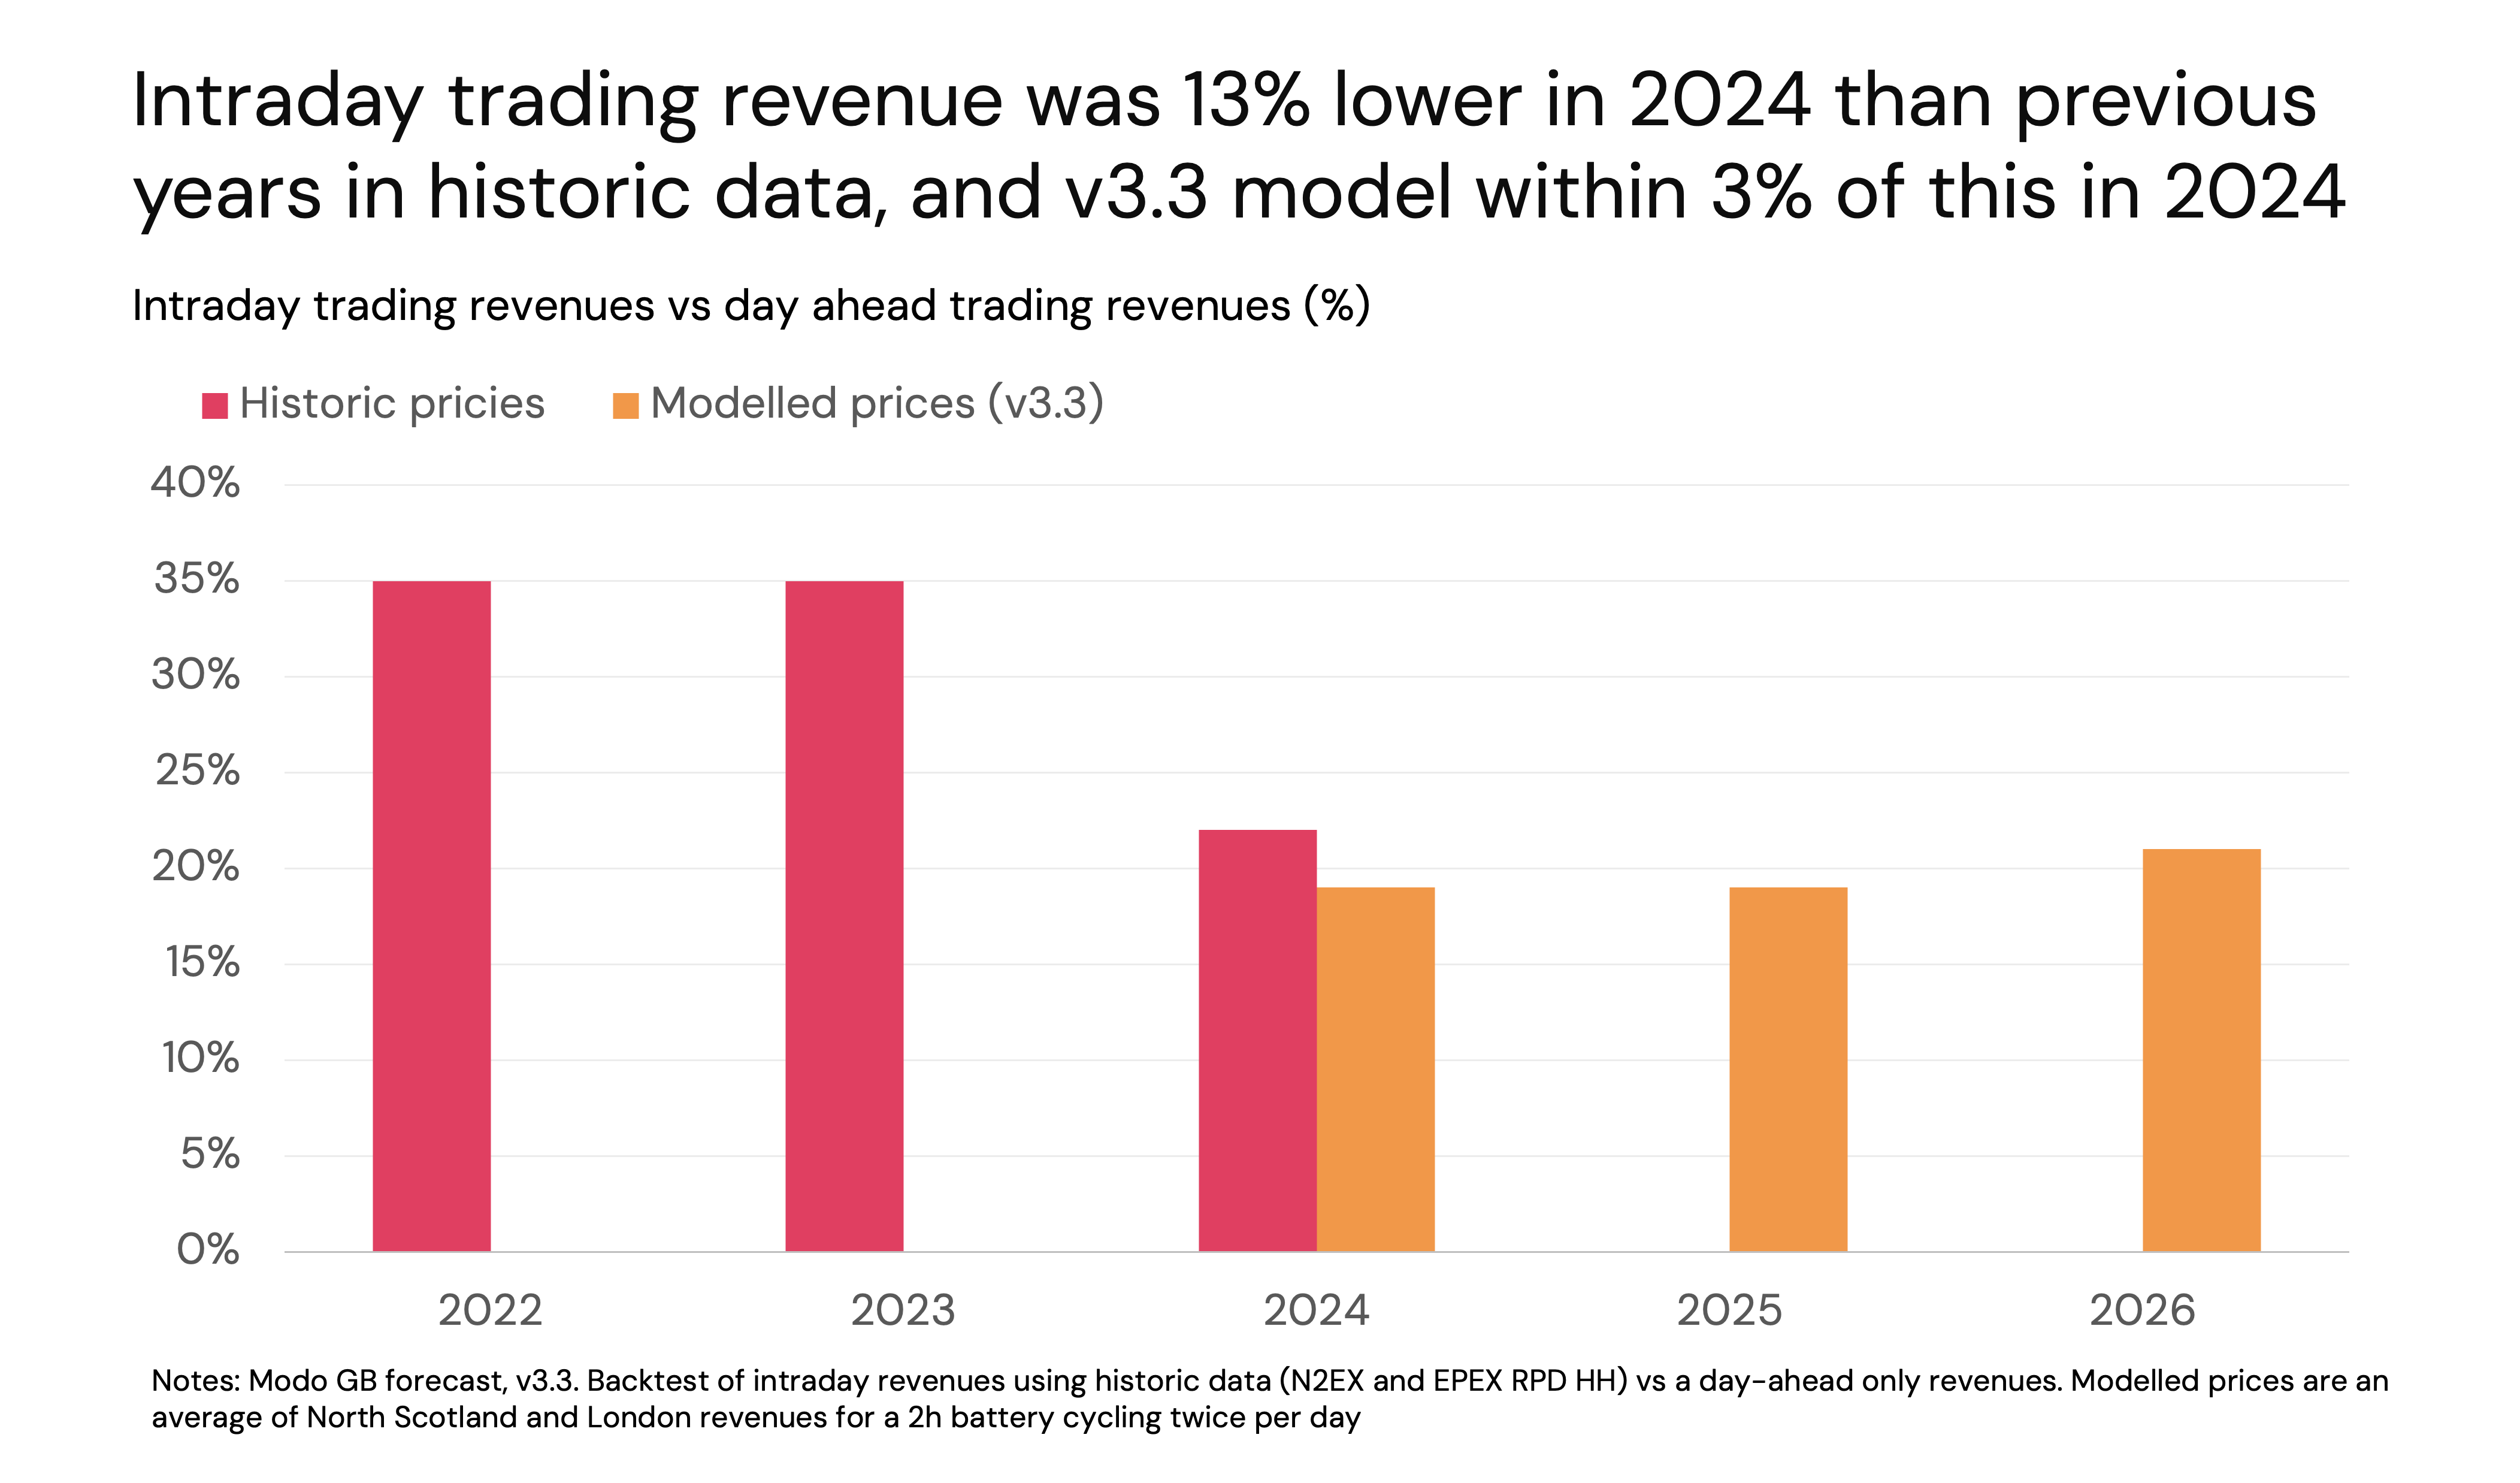
Backtesting intraday revenues
Updated 9 months ago