
Model calibration
Taking our fundamentals model back to reality
TLDR; The Modo forecast is calibrated to real-world numbers using the Modo benchmark
To capture the realities of trading a battery in GB, we use historical data - both forecast and real-world and apply calibration to the forecast battery revenues going forward.
Modo Energy's ME BESS Index tracks each battery energy storage asset above 7MW across Great Britain. It calculates their earnings during each half-hour of each day across day ahead wholesale markets, intraday, frequency repsonse and reserve markets, the capacity market, balancing mechanism and imbalance. More information on accessing this data can be found on our Indices and Benchmarks pages.
As of April 2025, there are 144 sites in GB, tracked by Modo Energy, consisting of 5.3GW of battery energy storage systems.
This gives us real-world data to calibrate our forward-looking numbers, taking our revenue forecast from a fundamentals-backed model to one cemented in reality.
We compare fleet revenues to the model backtest
In 2025, the GB BESS fleet consists of batteries ranging from brand new to over seven years old. Improvements to battery technology over this time mean that newer assets benefit from enhanced protection against degradation, higher cycling allowances, better temperature regulation, and higher energy density. This means they can have more advanced optimisation across markets and greater availability compared to older assets.
Older assets may have suffered significant degradation from their nameplate capacity (used to normalise revenues in the ME GB BESS index). They typically are able to do less trading and, as a result, have a lower opportunity cost. This means they may also take lower prices in frequency response markets.
As a result, in v3.4 of the forecast, we see a widening gap between the lowest and highest-earning batteries.
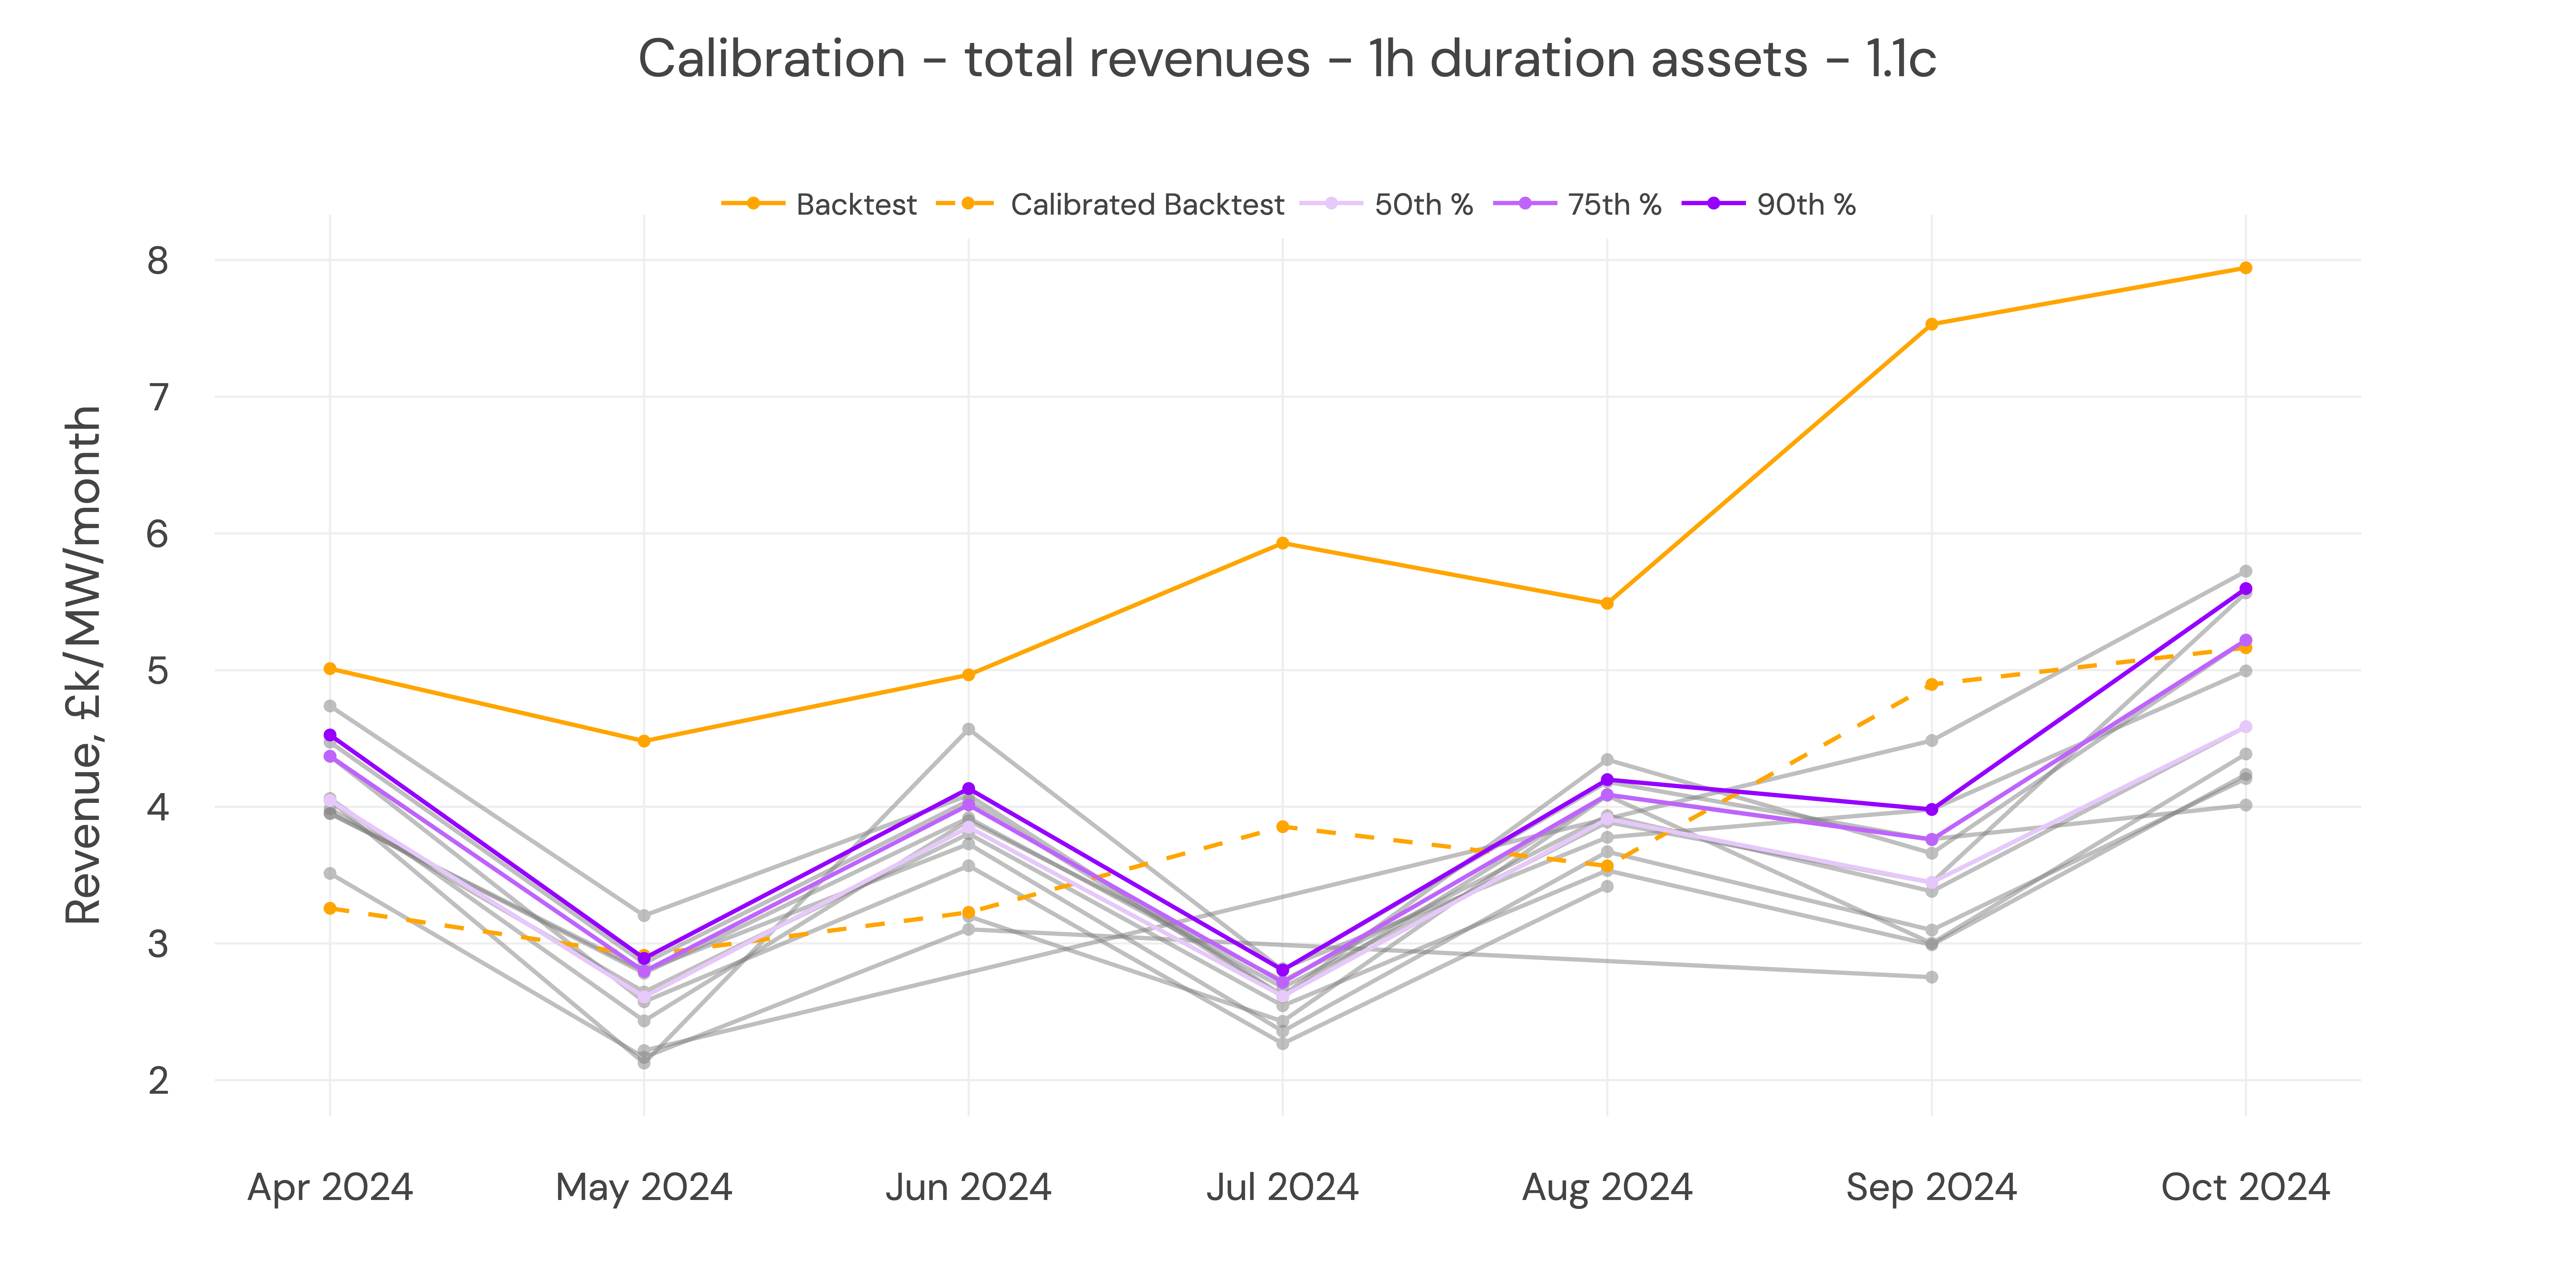
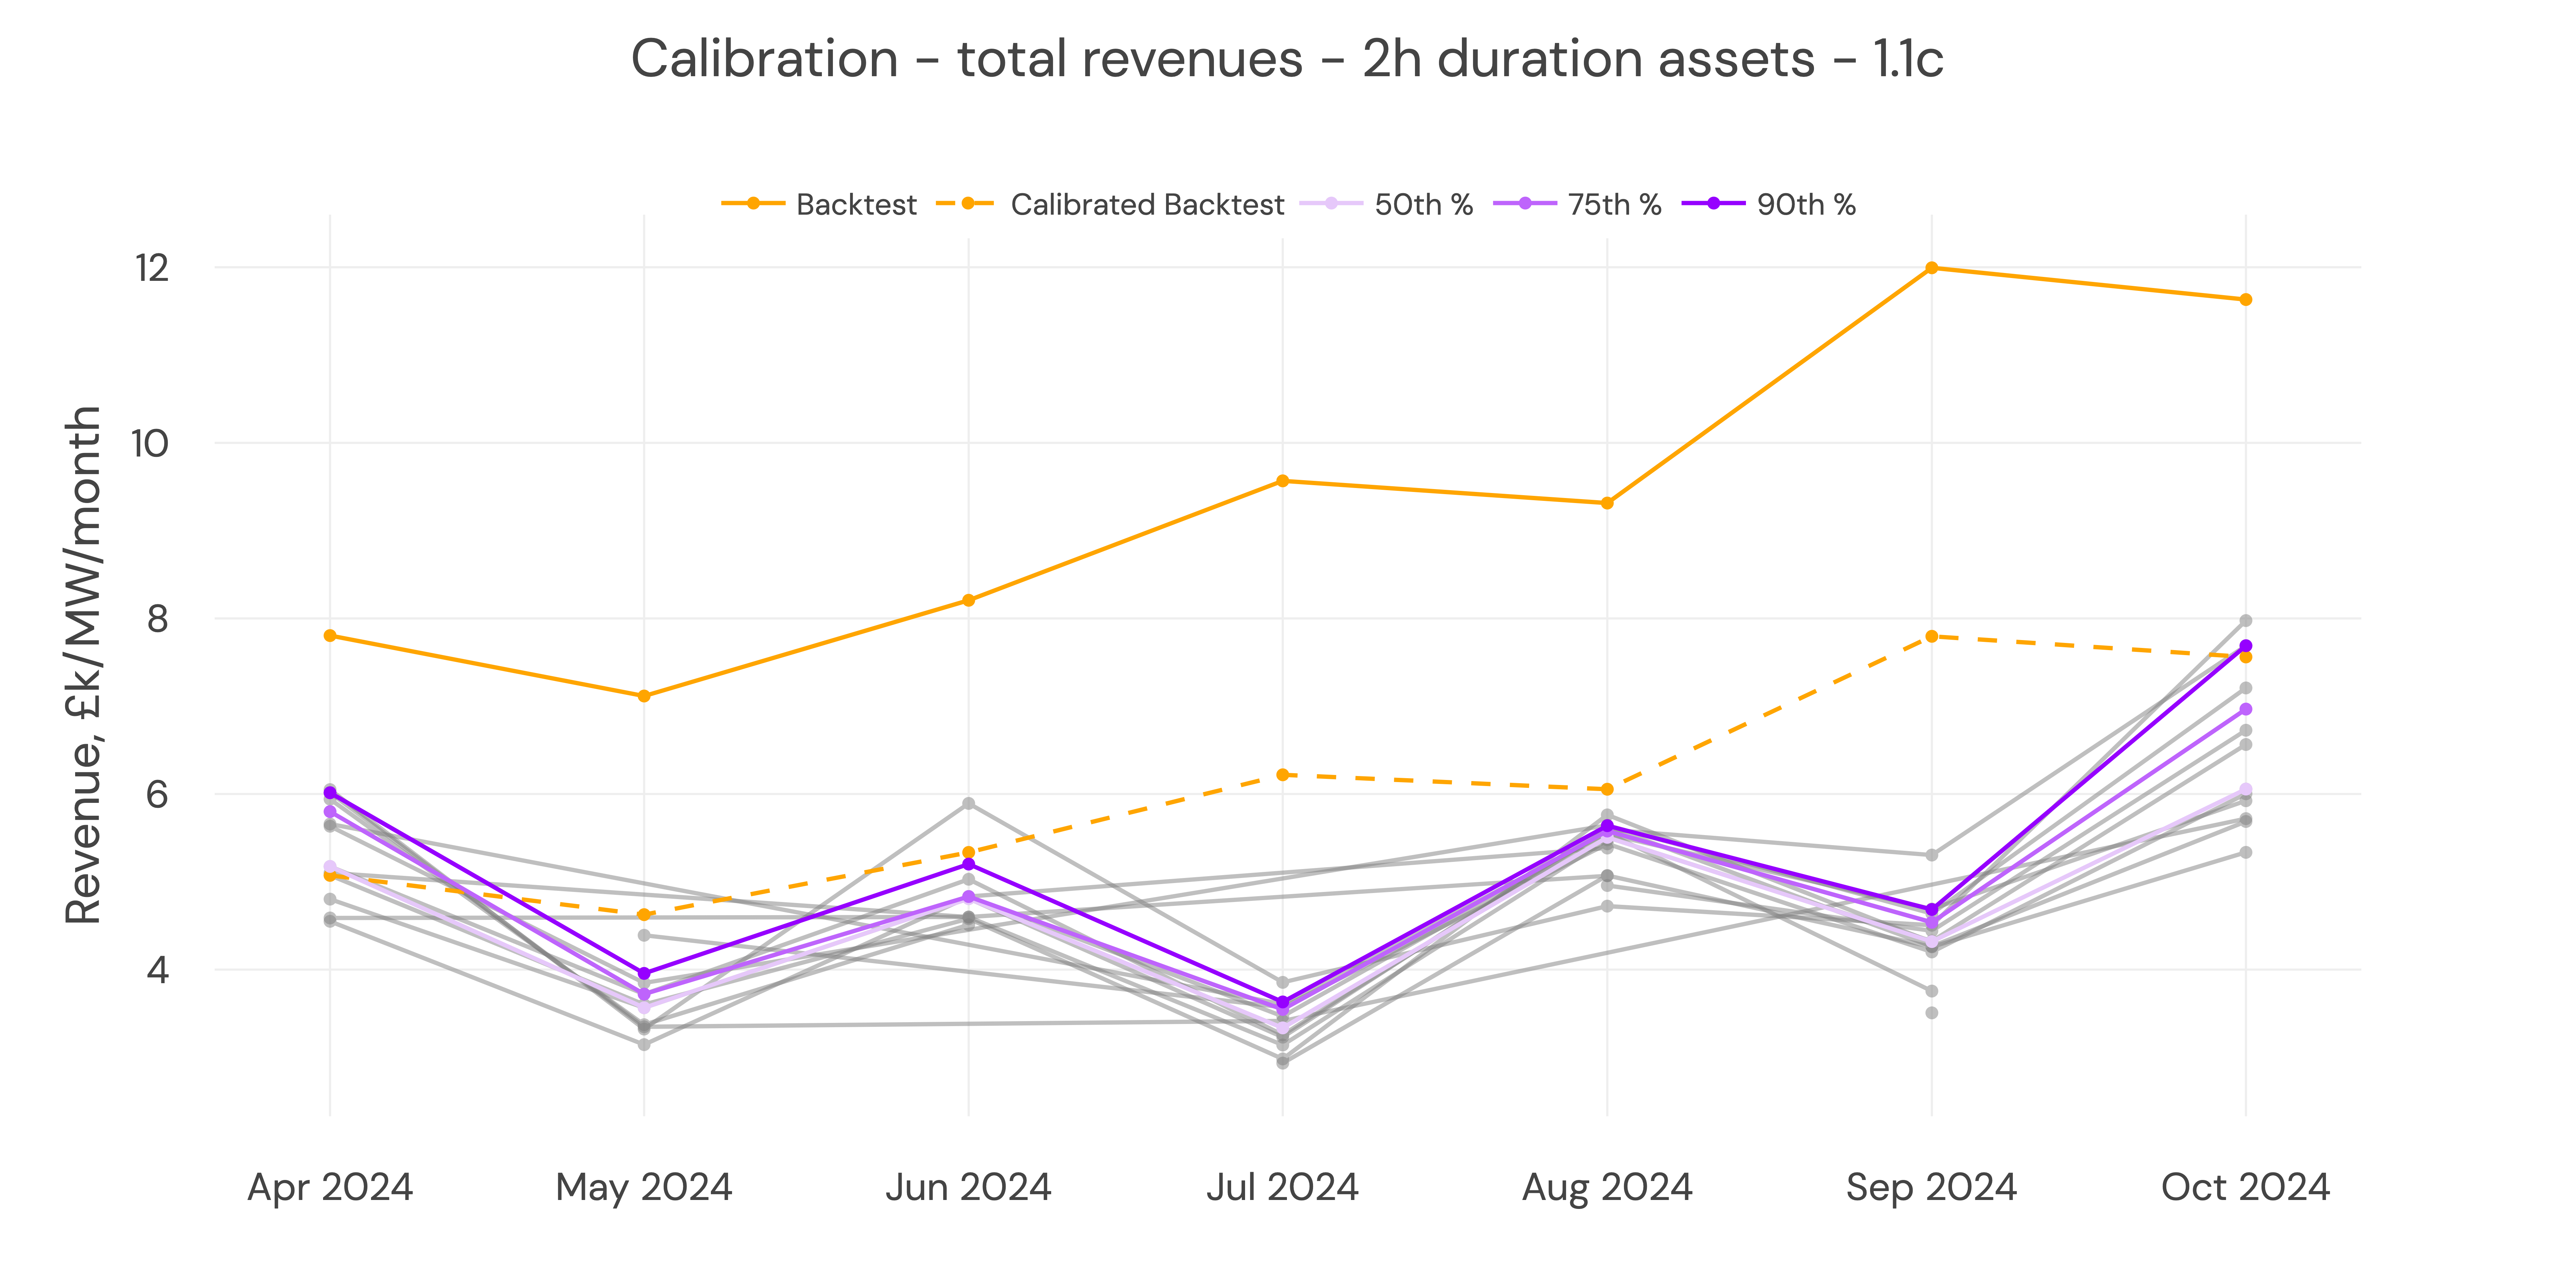
To keep our revenue calibration relevant to newer assets, we use the 75th percentile of fleet revenue from Wholesale (both Day-Ahead and Intraday), Dynamic Frequency Response, Balancing Mechanism and Balancing Reserve markets and compare to backtest revenues in the same markets. Backtest revenues are calculated using historical price data as input to our dispatch and Balancing Mechanism models.
We use revenues for Balancing Mechanism-registered battery assets in Wholesale, dynamic frequency response, Balancing Mechanism and Balancing Reserve markets from April to October 2024.
We take each site's monthly revenues and compare them to our dispatch model backtest to come up with a calibration.
Calibration that captures the realities of asset operation
There are a host of reasons why our fundamentals backed-model will outturn higher than actual observed revenues in the market, hence why this calibration is necessary.
- Battery availability is less than 100%. This could be due to distribution or transmission network downtime, transformer outage, cell outage, etc. This accounts for ~5% of revenue differences.
- Degradation from nameplate MWh capacity as the battery cycles. This accounts for ~3% of revenues.
- High levels of participation in competitive Frequency Response services, meaning you're not guaranteed to win a contract. We assume a level of saturation in each market as observed historically, but individual assets will have different opportunity costs and win contracts accordingly.
The dispatch model assumes a high level of optimisation and further, cross-optimisation between different markets. In v3.4, there can be a significant amount of non-physical trading. Not all of this is captured within the ME GB BESS index, and so further differences are related to perfect foresight in the forecast vs reality, and assumptions we make within the dispatch model.
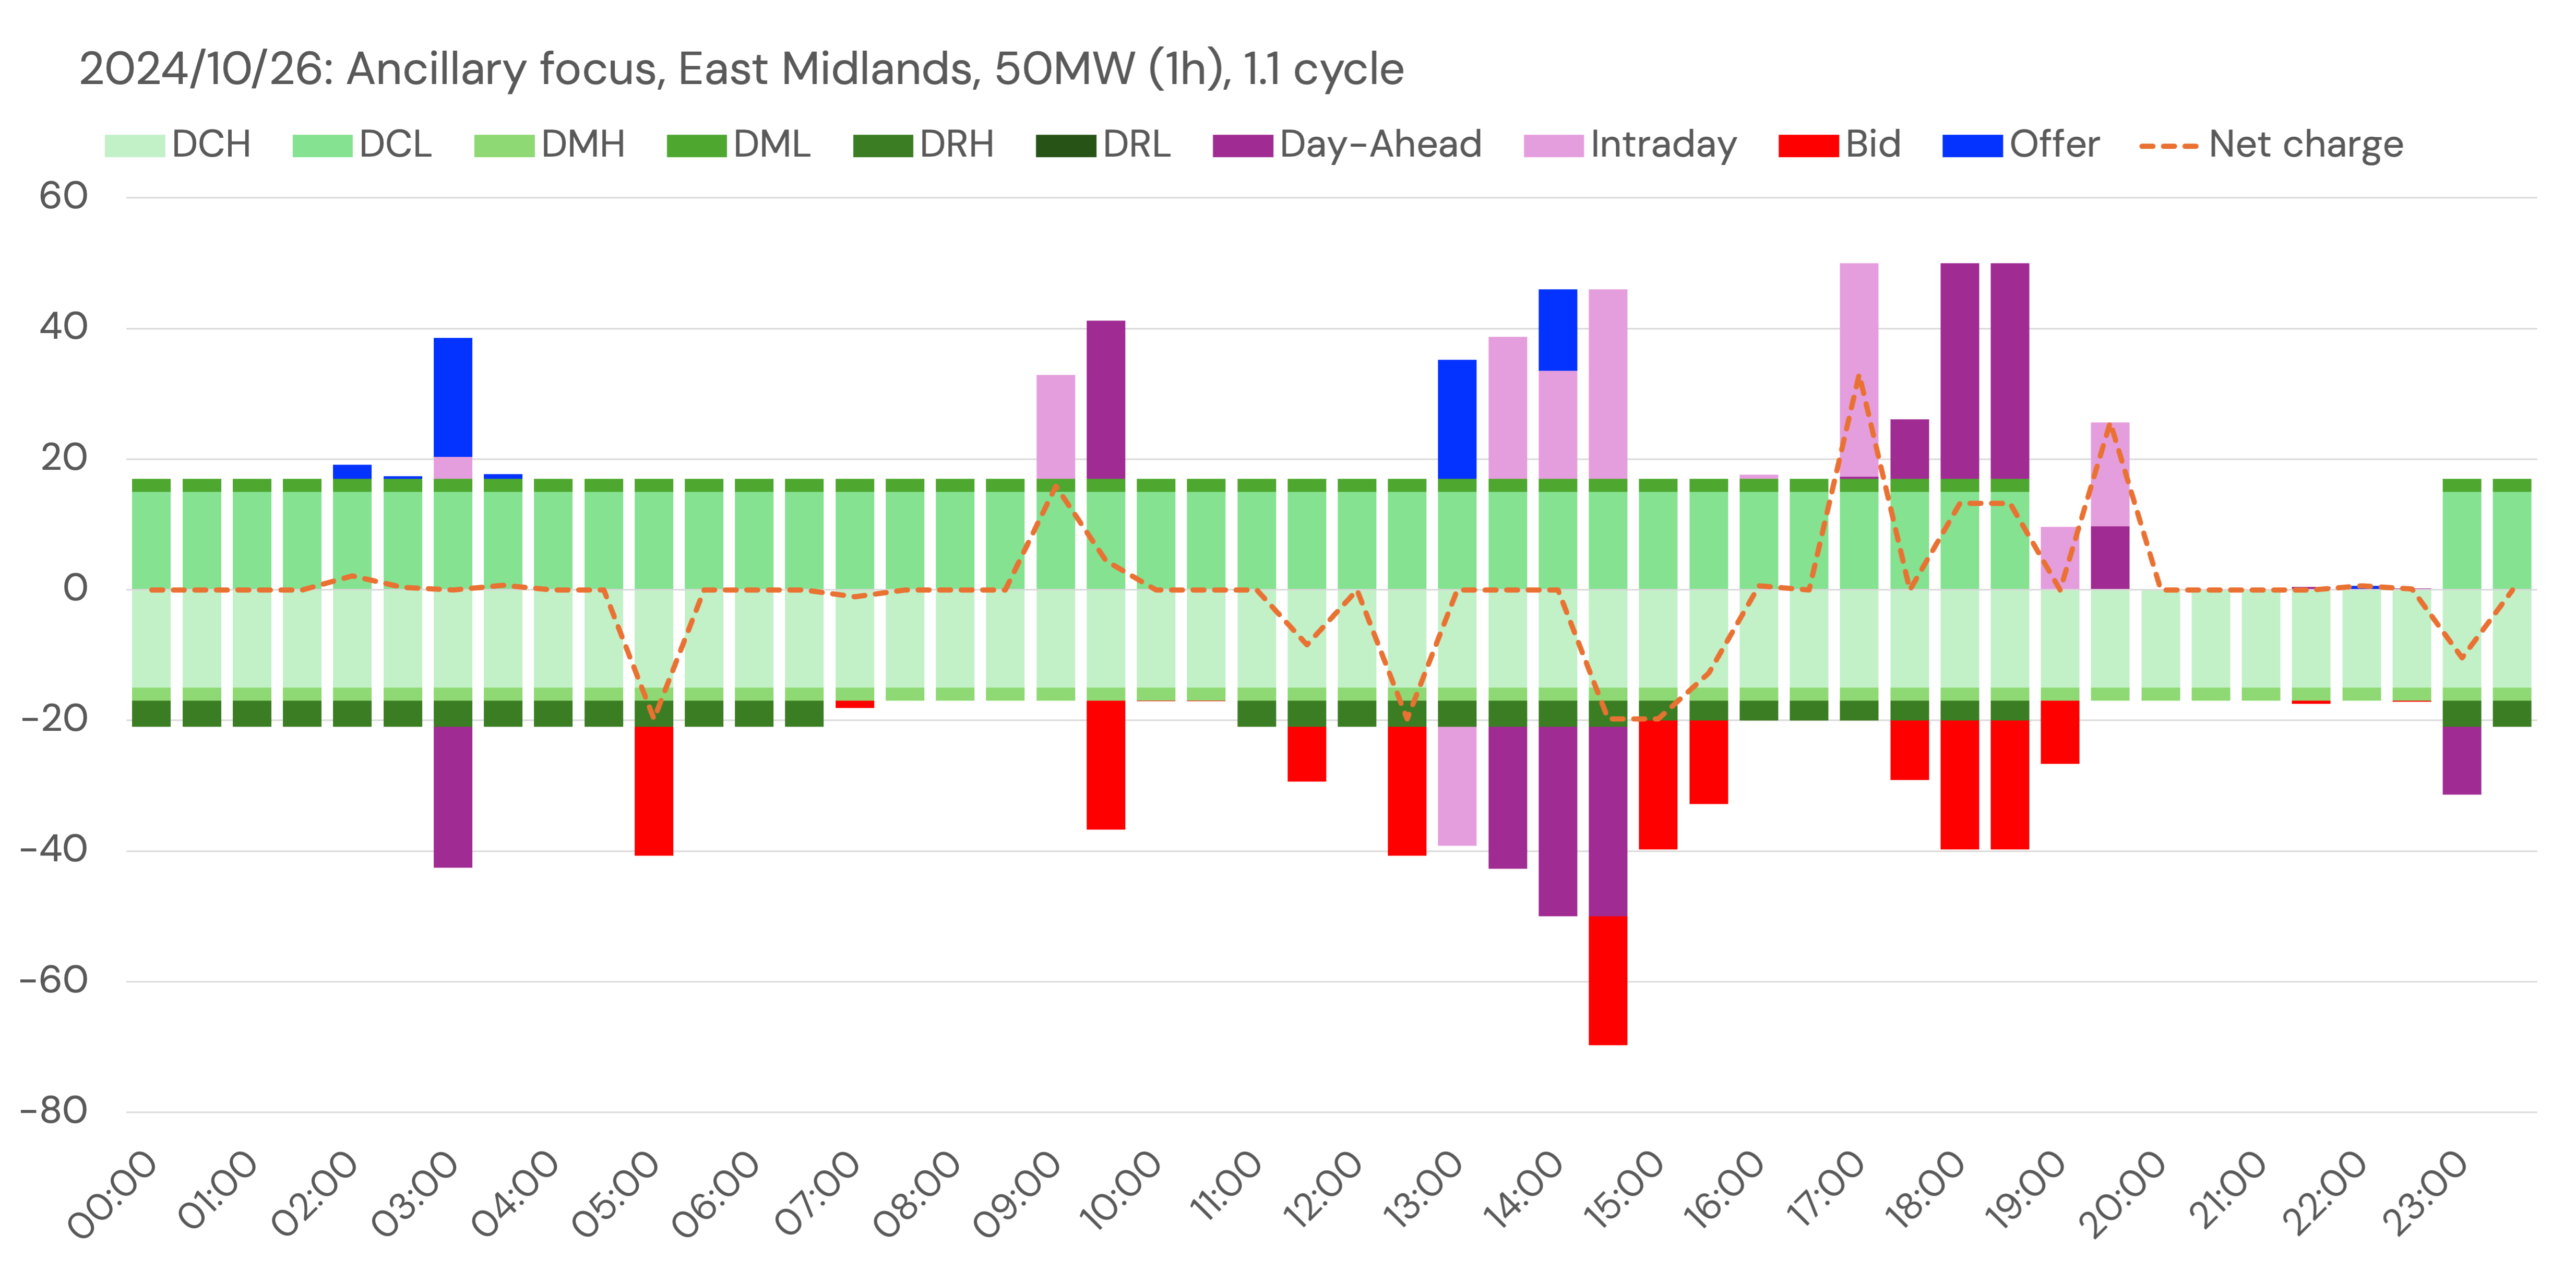
Example day of dispatch for 1h asset in East Midlands in Backtest. v3.4
- The ME GB BESS Index captures churn (or non-physical trading) between Day-Ahead or Intraday trading to Balancing Mechanism. This results when a submitted physical notification (either for a Day-Ahead position or an Intraday position) gets turned up or down via a bid or an offer. However, where there is no data visibility for the change between a Day-Ahead and an Intraday position, it does not capture the Day-Ahead to Intraday churn. This is valued in the forecast, when we re-optimise the Day-Ahead position in Intraday markets with a 2h rolling window. The impact of this is the forecast will be ~10% higher than the benchmark.
- The dispatch model then takes the intraday position, and optimises this in the Balancing Mechanism, assuming 24h foresight of BM dispatches, and rebalancing in intraday markets (using foresight of day-ahead prices). In reality, the Balancing Mechanism will be dispatched in real-time, with a reasonable price and dispatch rate foresight of a few hours.
- We optimise a battery in the BM over 24 hours largely to avoid lengthy rolling BM dispatches against rolling Intraday positions (like some) currently observed in the market and hint at current market inefficiencies.
- The impact of 24h of perfect foresight vs a 2h rolling window of price foresight in the BM is around 20%.
By comparing the output of our revenue forecast to reality, we can capture the impact of all these effects (and more) - making the revenue forecast more realistic.
Calibration results in today's forecast revenues aligned to today's revenue levels
Our central case uses the 75th percentile.
The low case uses the 50th percentile, and the high case uses the 90th percentile.
Updated 9 months ago