
Demand
In the last few years, demand has gone down. In future, it will go up as energy use is increasingly electrified.
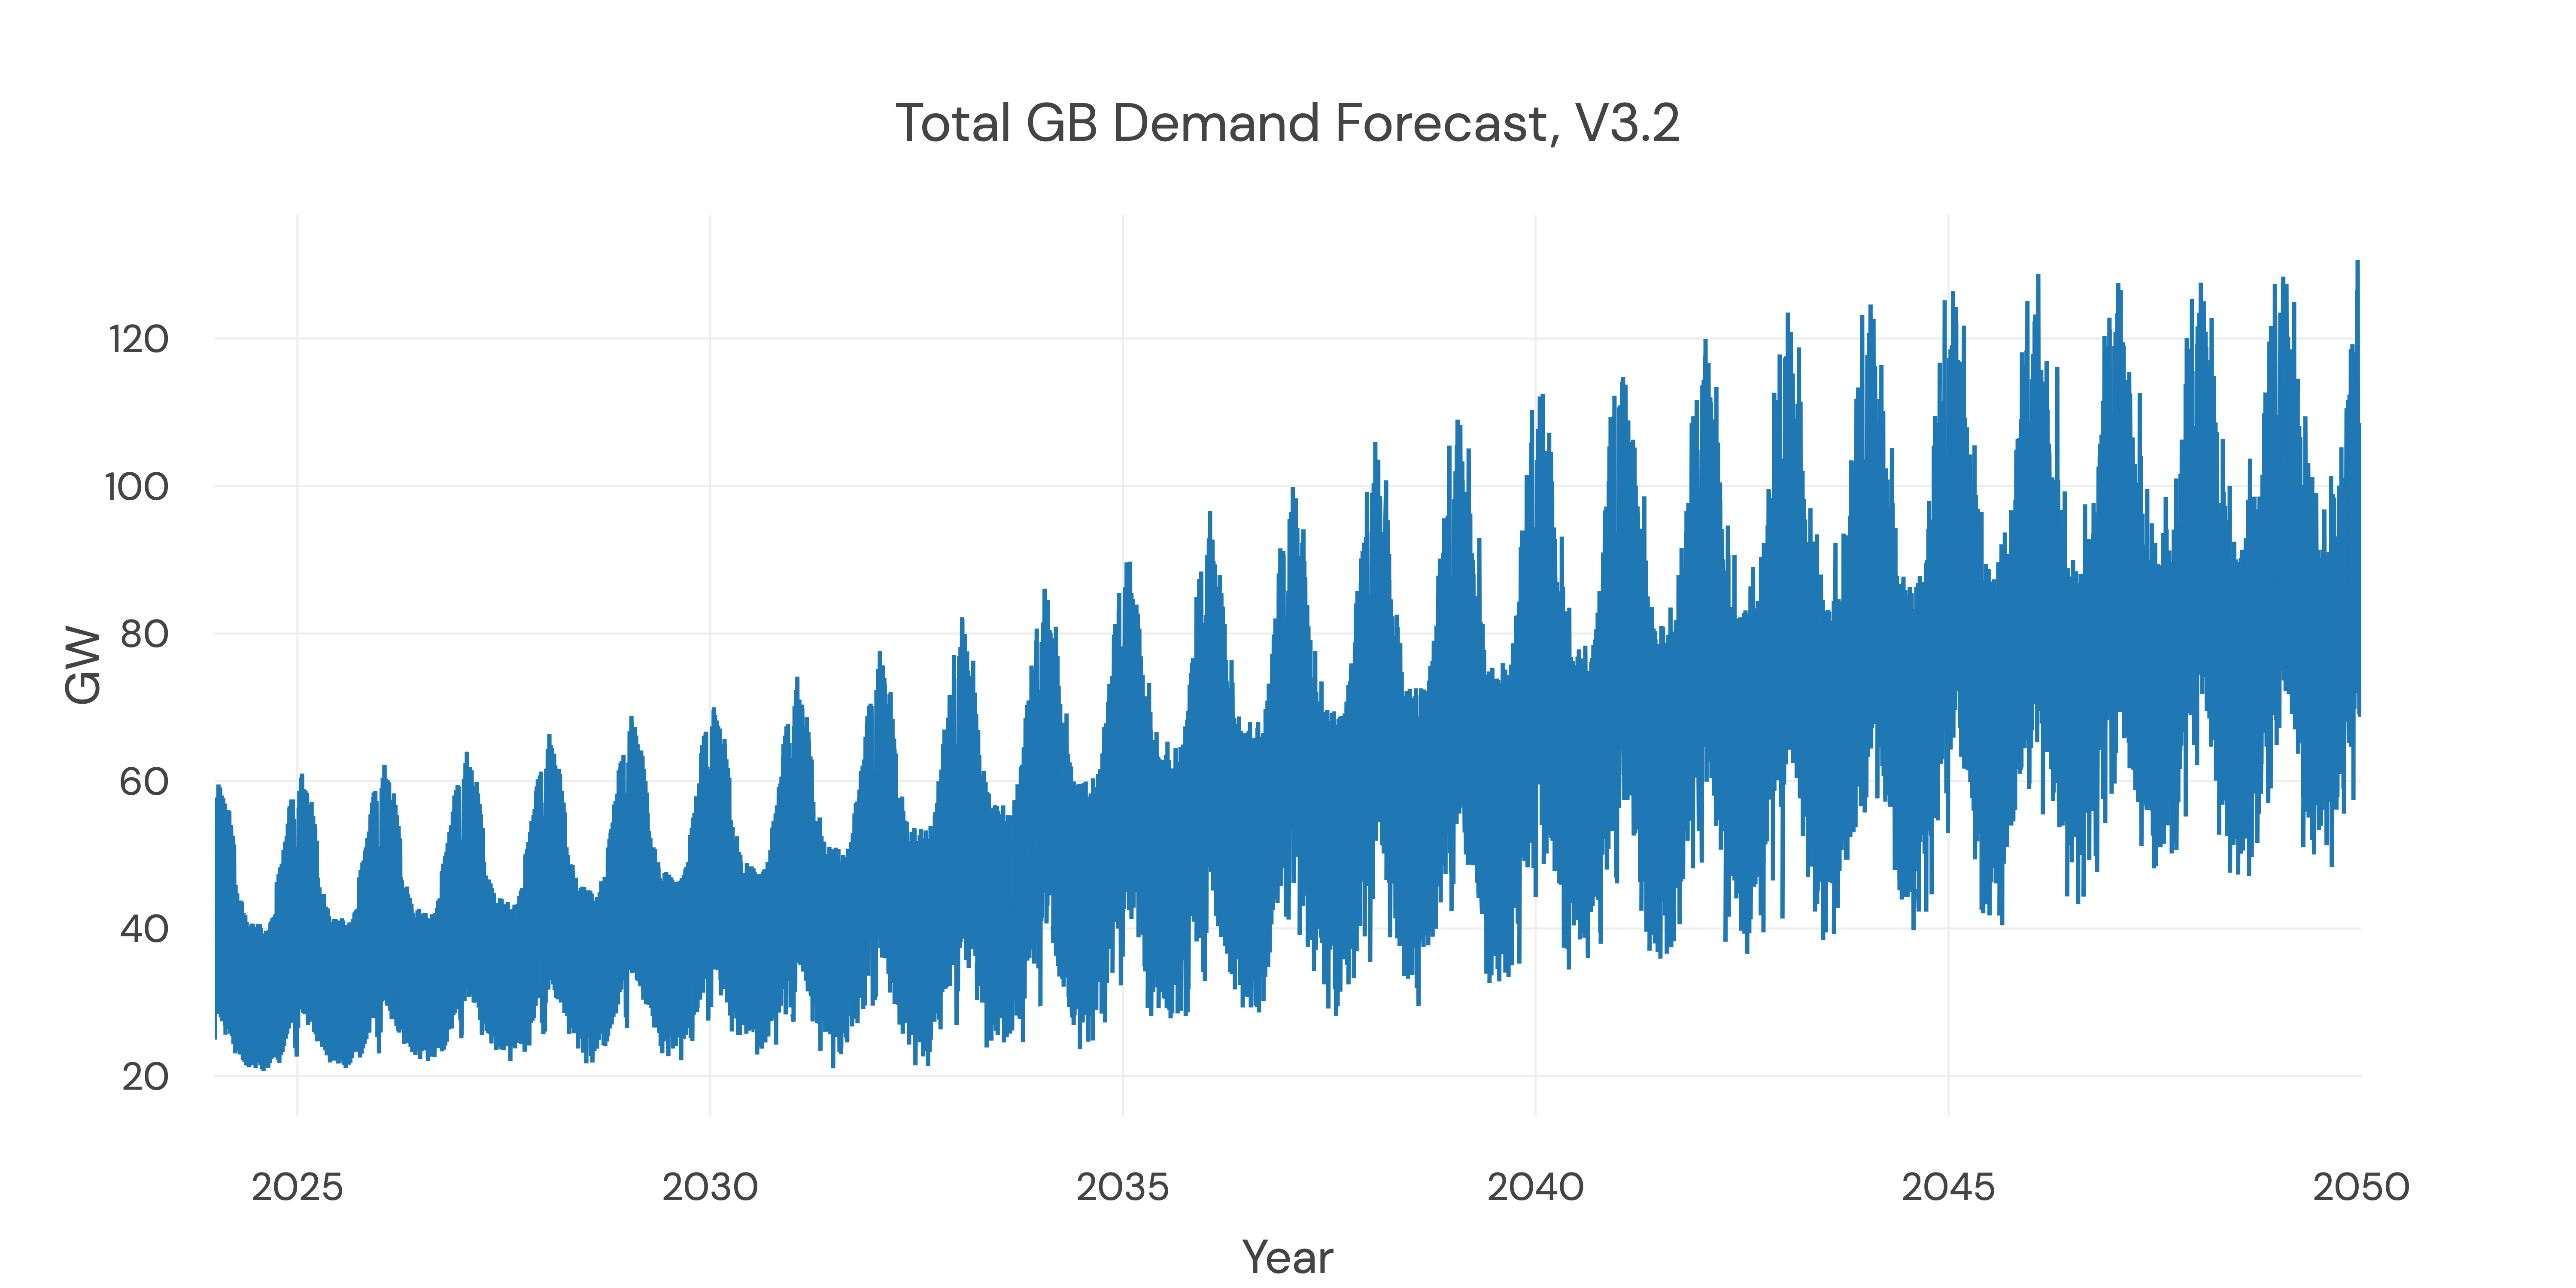
We look at the changing shape of demand over the last 15 years: generally, we've been using less electricity. Daily and yearly minimums have been decreasing (as have the peaks). But, with the electrification of heat, industry and transport, this is expected to change, and demand will increase.
We use the FES numbers that give the maximum and minimum demand per year. These are quoted without transmission and distribution losses - ie excluding the losses of around 2% of energy due to the resistance of the lines that transport power around the country. The annual maximum gives the winter peak (when demand is highest) and annual minimum gives the 2pm summer Sunday minimum (when demand is lowest).
Then, we build a half-hourly demand shape around these based on a time-series analysis of historical data. This means using past behaviors on time of day, day of the week, month of the year, etc., to model the future.
However, with more and more EV charging (much of it at night), and heat pumps (which will replace a lot of the energy peak demand currently met by gas), we expect the daily demand shape to change. So, we model these separately.
The final shape of demand also considers charging from energy storage, exports due to interconnectors, as well as price responsive Demand Side Response.
Demand in v3.2 and v3.3
Demand in v3.2 and v3.3
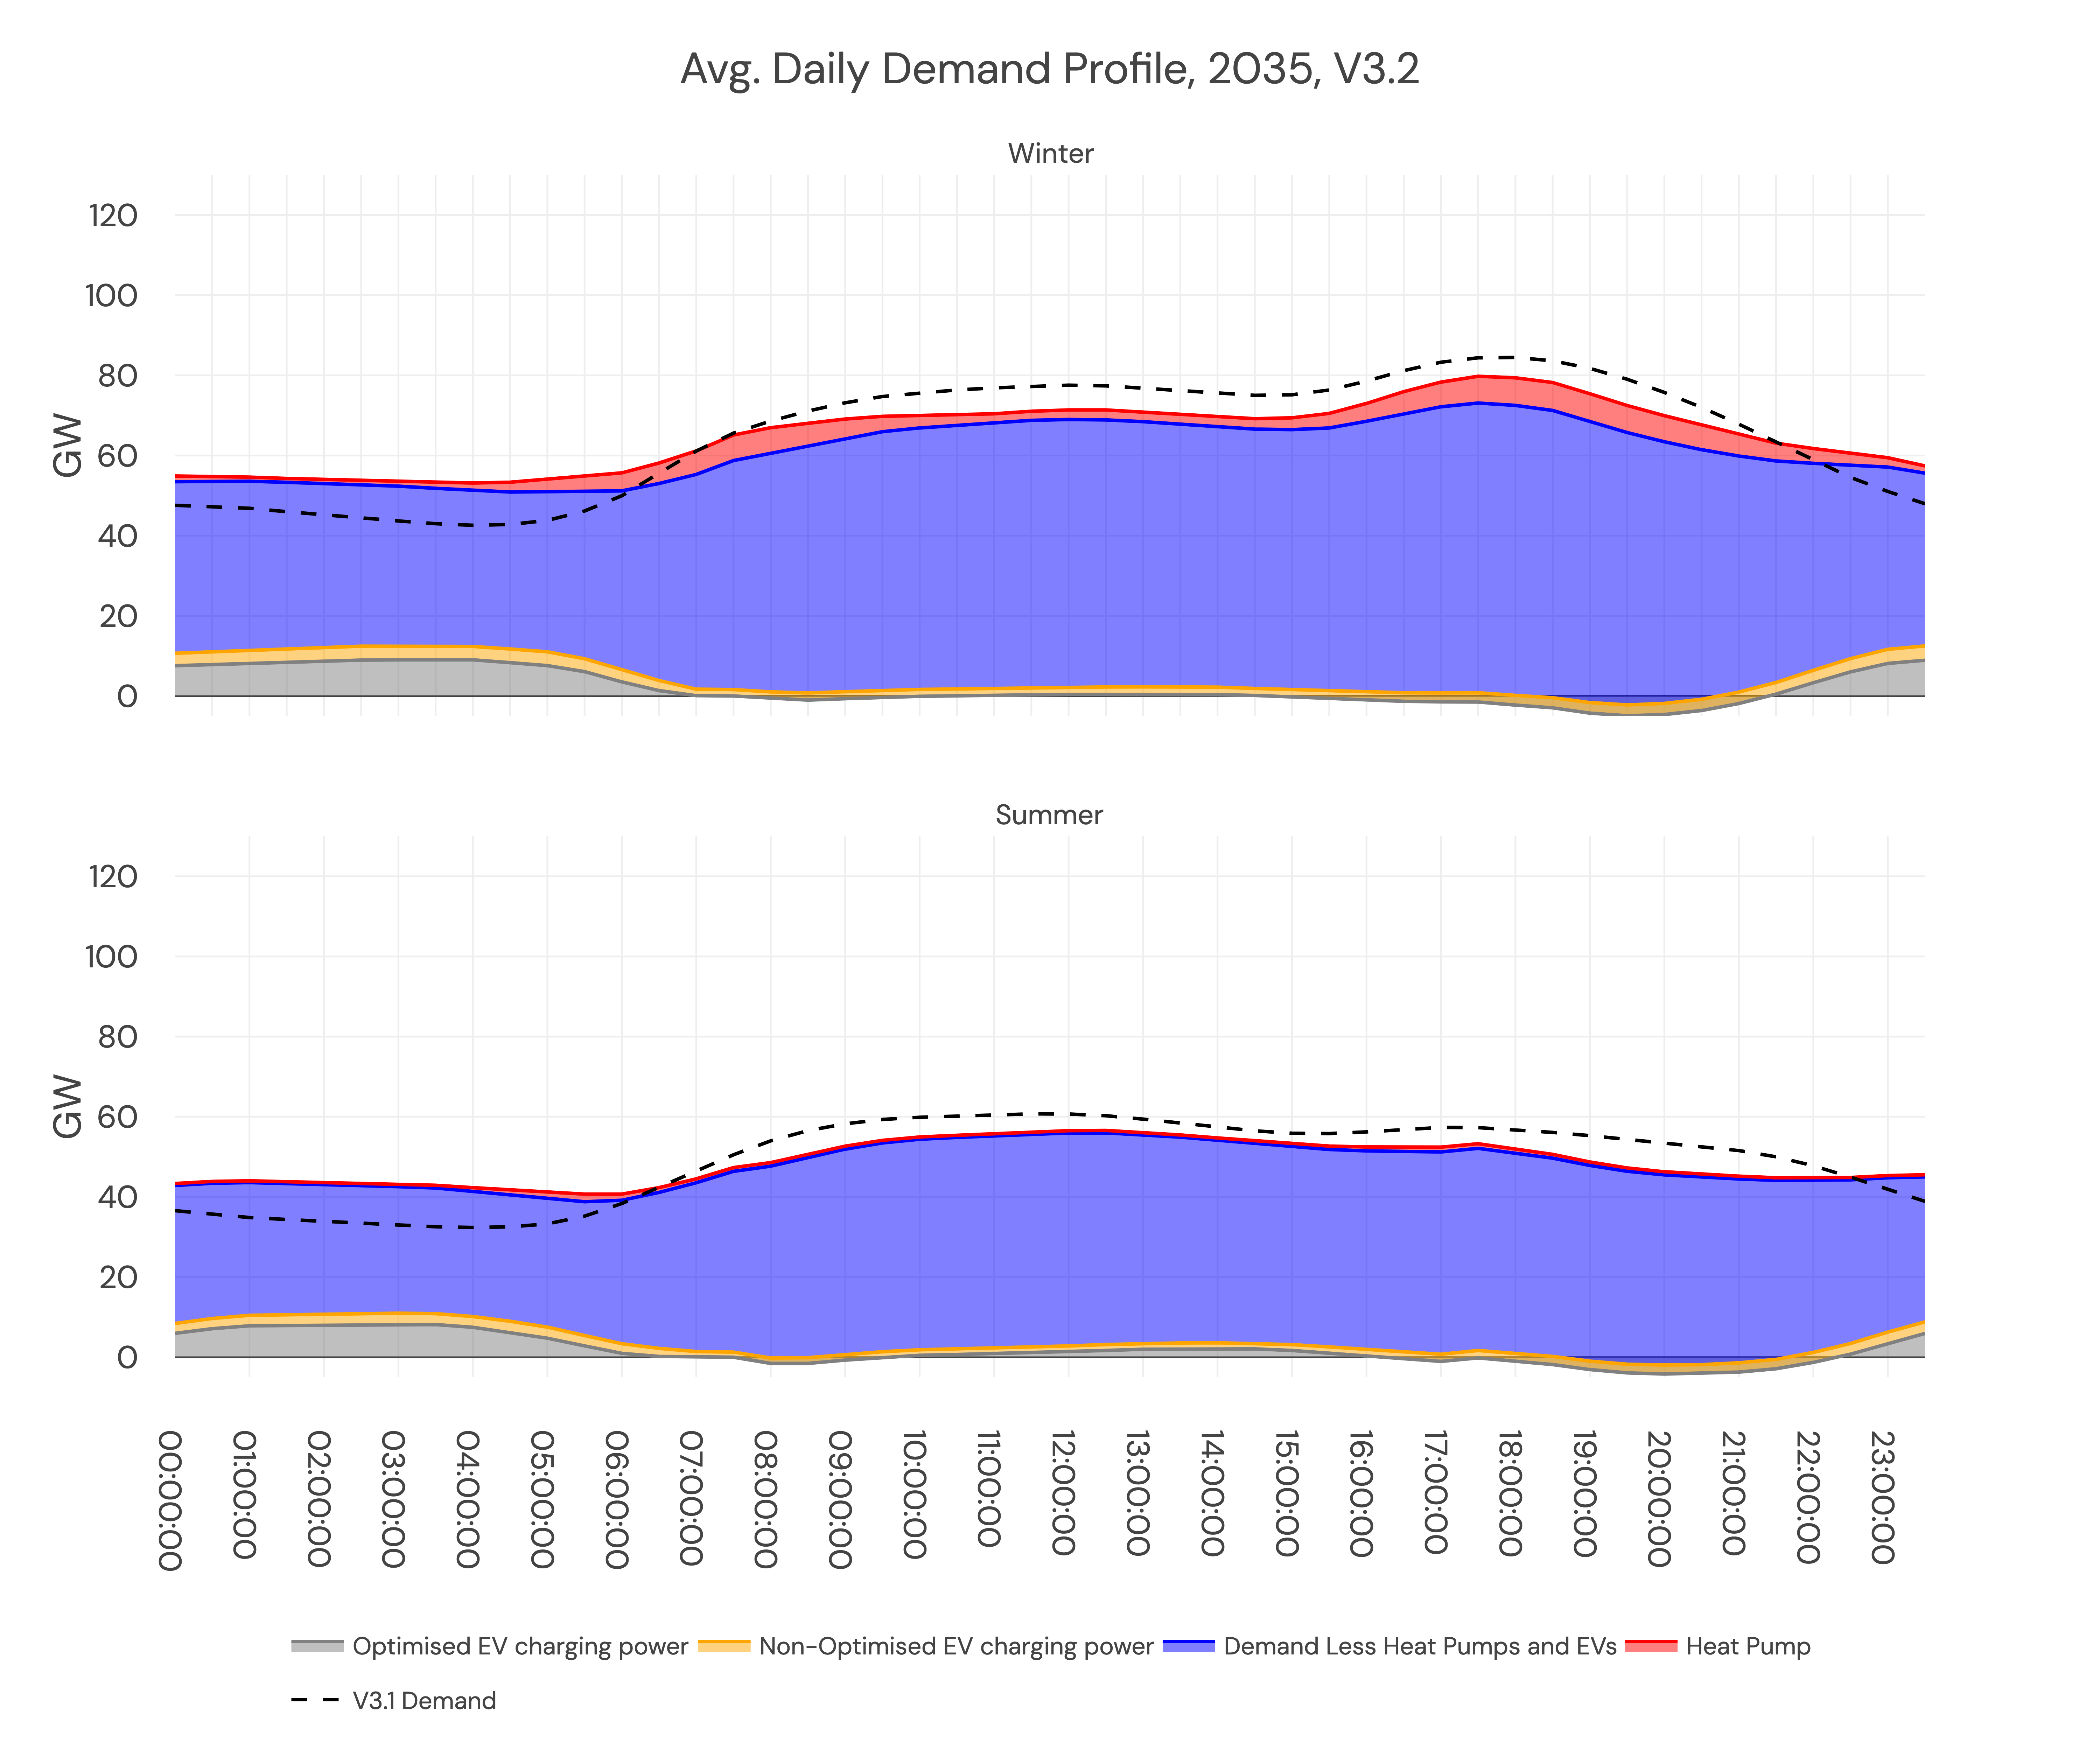
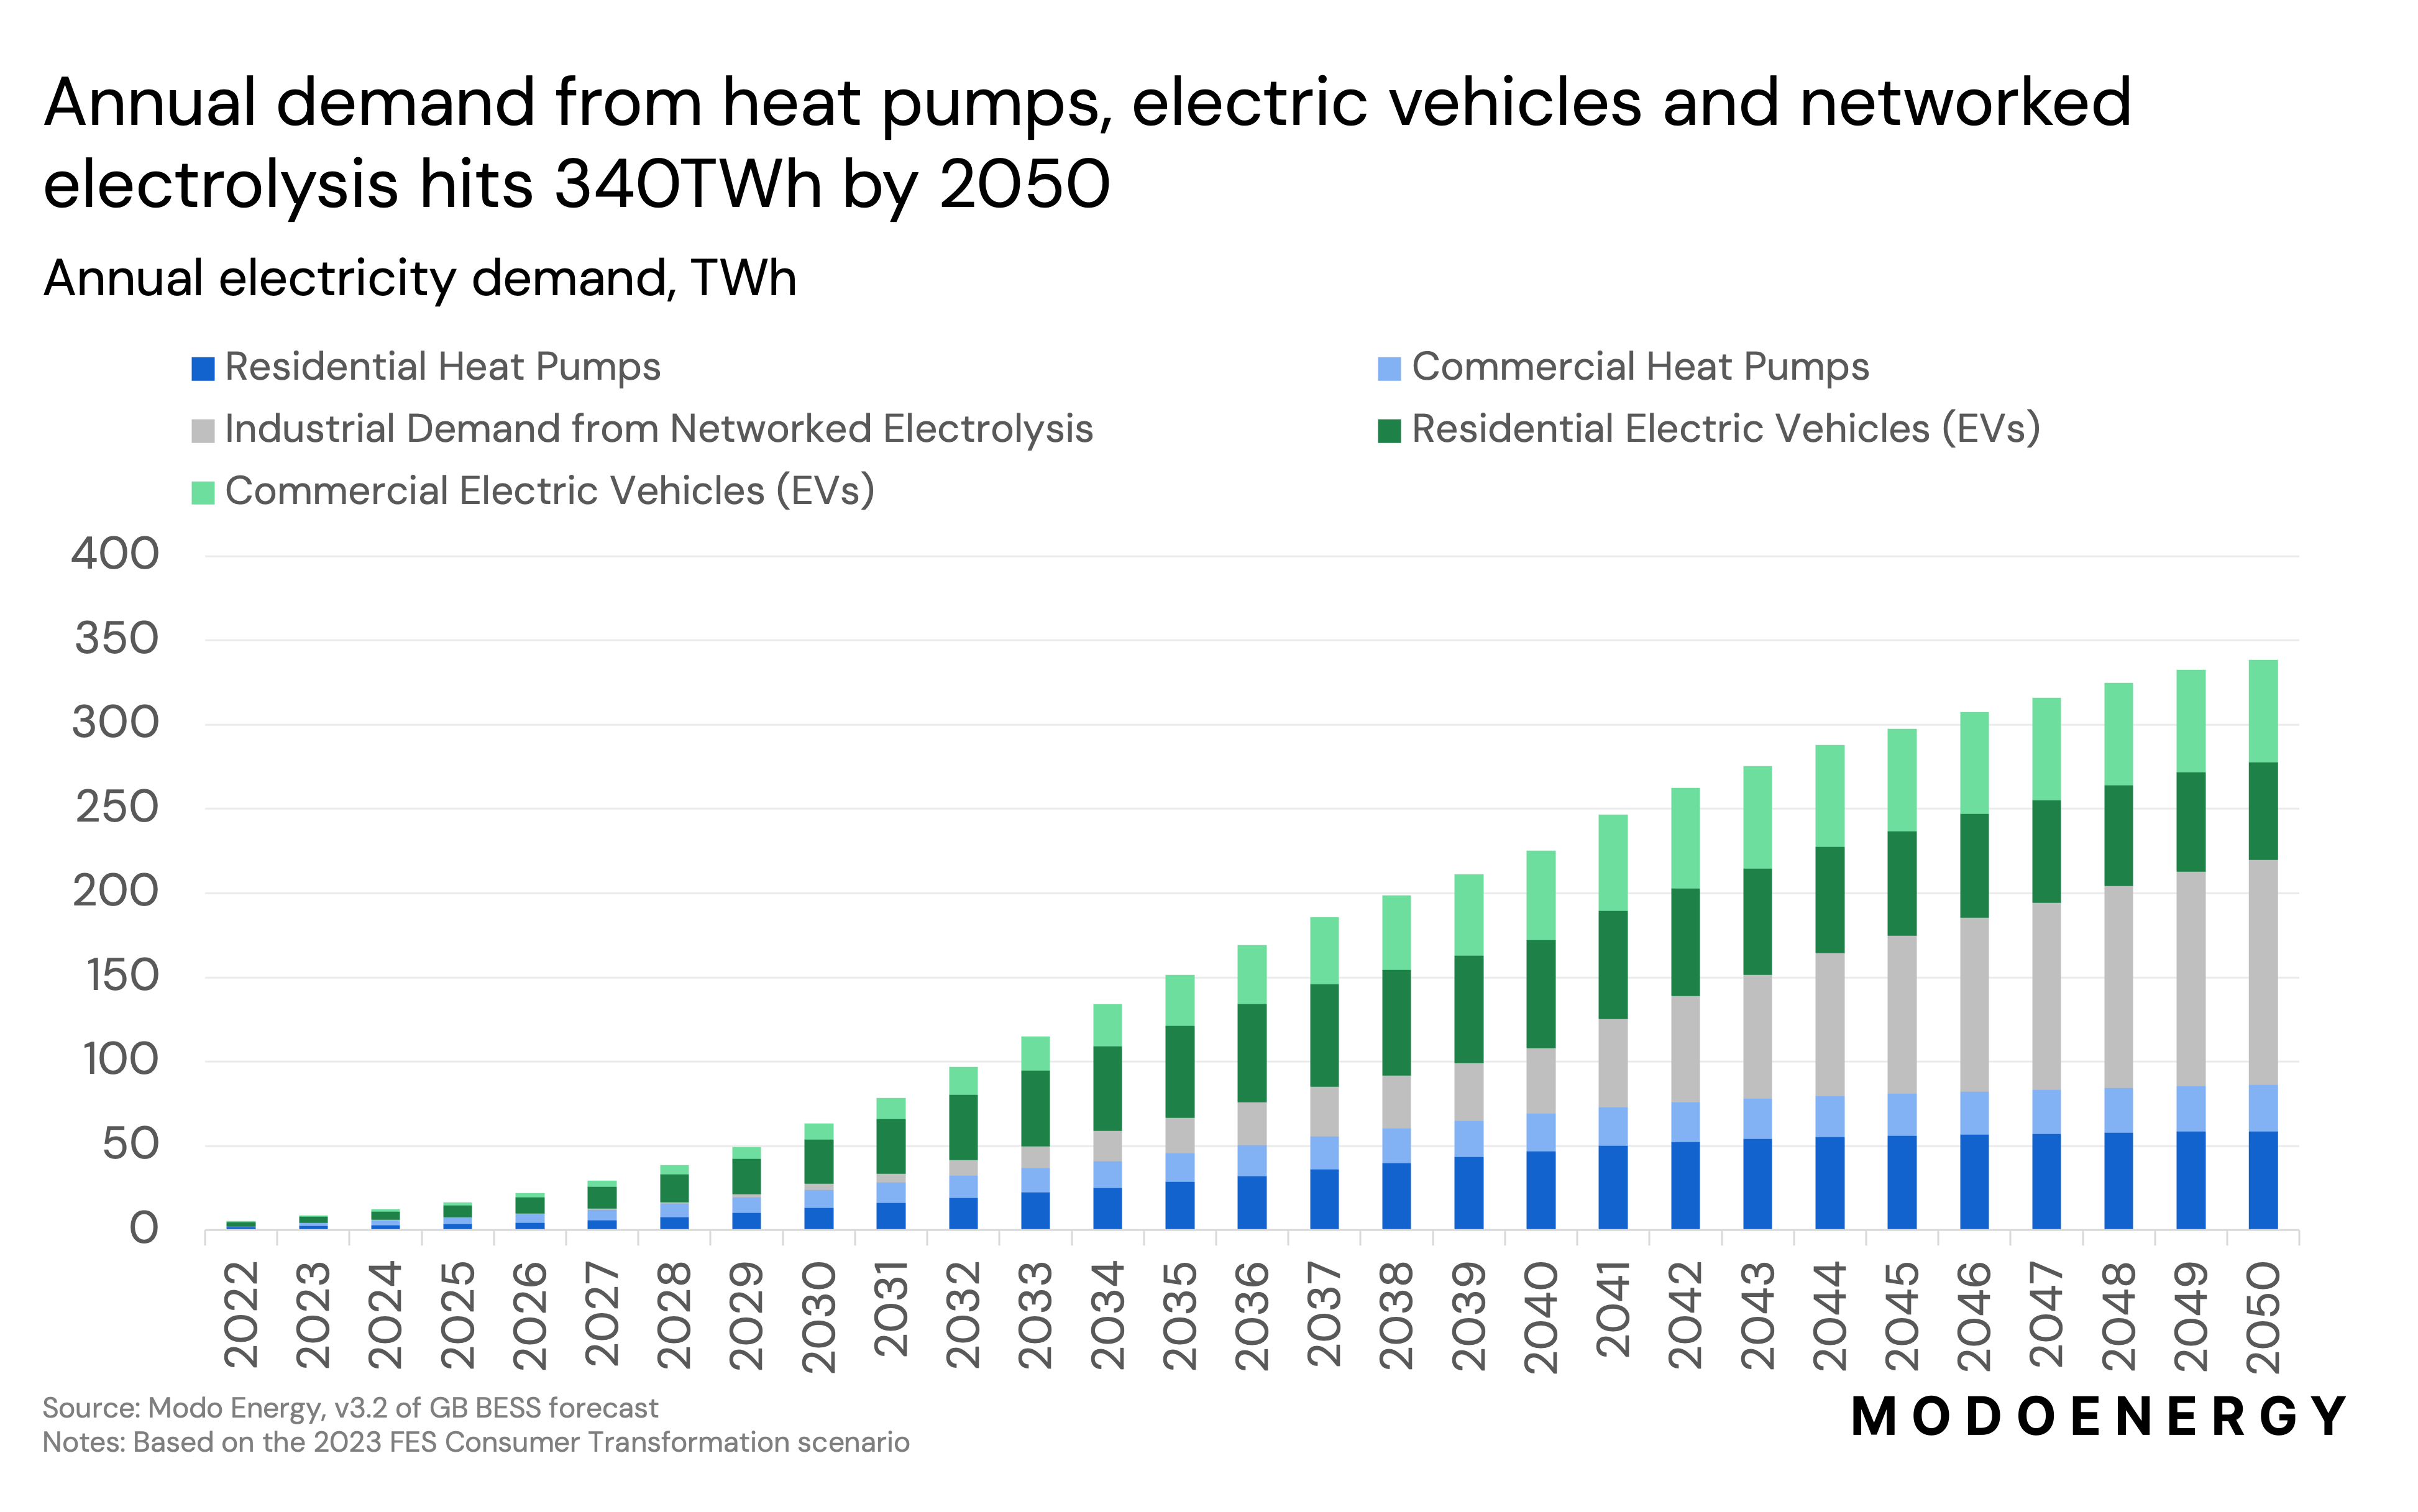
To capture changing demand shape, we model residential EV and Heat Pump demand separately
With the uptake of EVs and heat pumps expected to accelerate, the shape of demand will change. To capture these changes, we model residential heat pump and EV demand separately from all other demand. This gives a more realistic daily and seasonal demand shape.
The EV demand modeling leads to a flatter average daily demand shape, with demand shifting from peak periods to overnight
EV profiles in v3.2 and v3.3
Check out the subpages on EV demand and Heat pump demand for more detail.
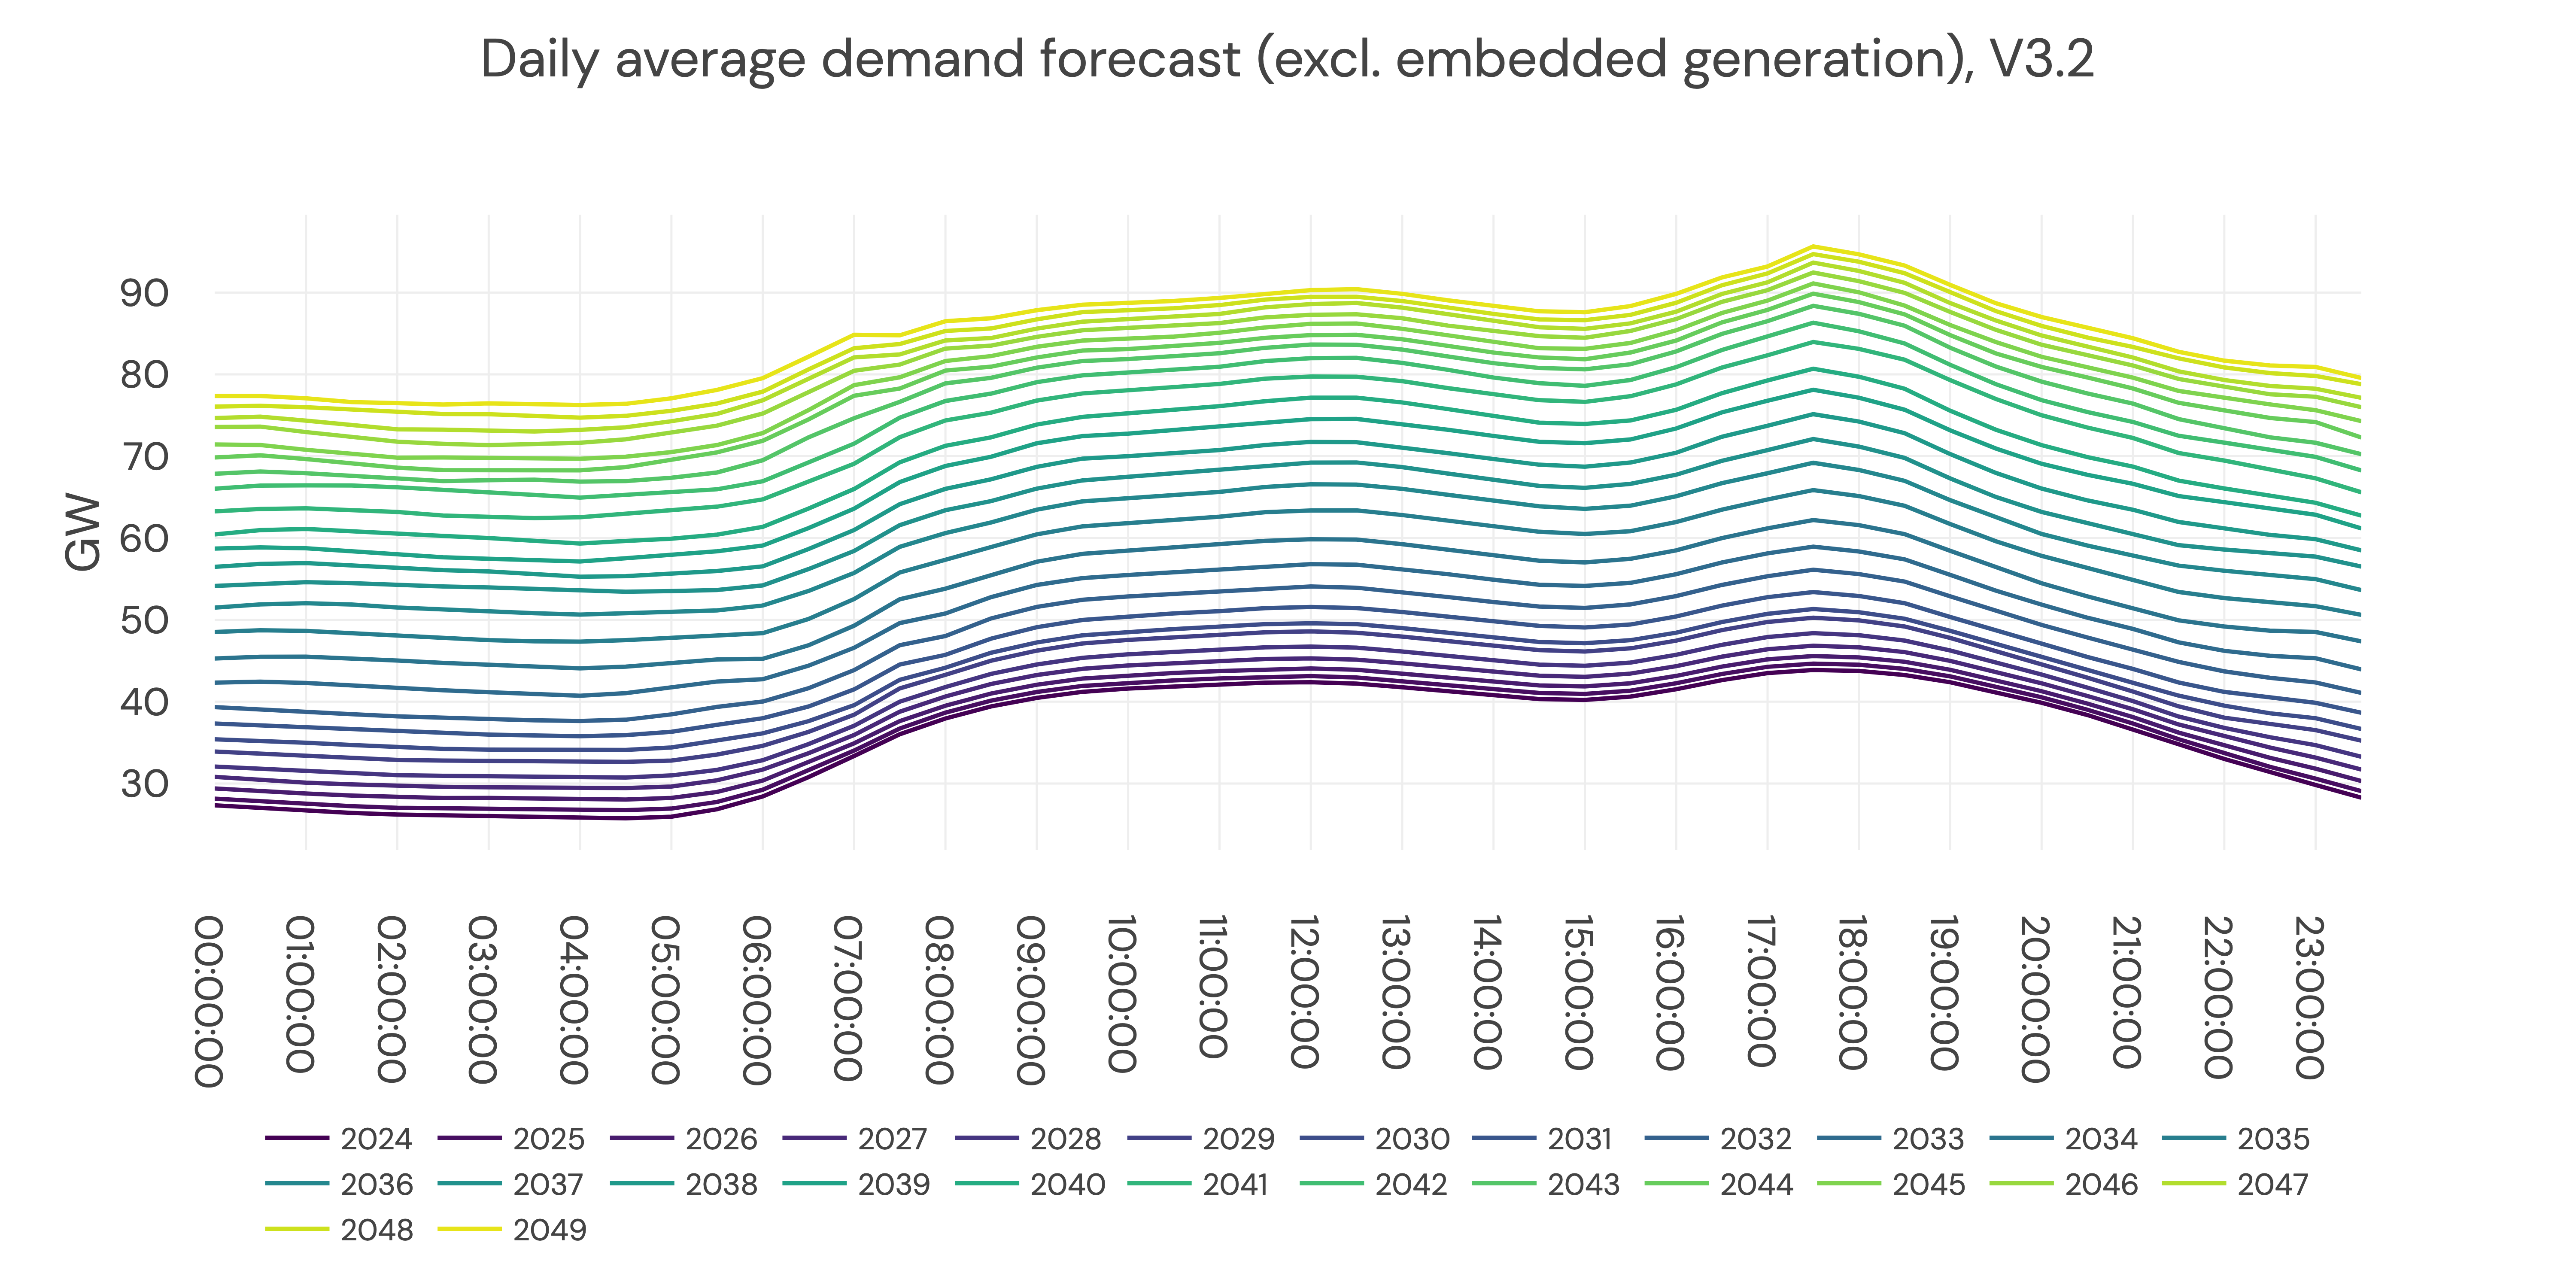
We model demand without embedded generation or losses
Embedded generation refers to electricity generation or storage that is connected to the distribution network, rather than the transmission network. According to the ESO, embedded generation accounts for 29% of generation capacity on the electricity grid in GB. Embedded generation presents a problem for the ESO as they don't have a real-time view of most of it.
We don't include embedded generation in our demand forecast, because it already exists in the supply stack, and we don't want to double-count it. We also model demand without transmission and distribution network losses - i.e. demand represents what all the generators on the system need to produce.
Therefore, there is no solar dip in the middle of the day - that comes later once we add embedded solar back in.
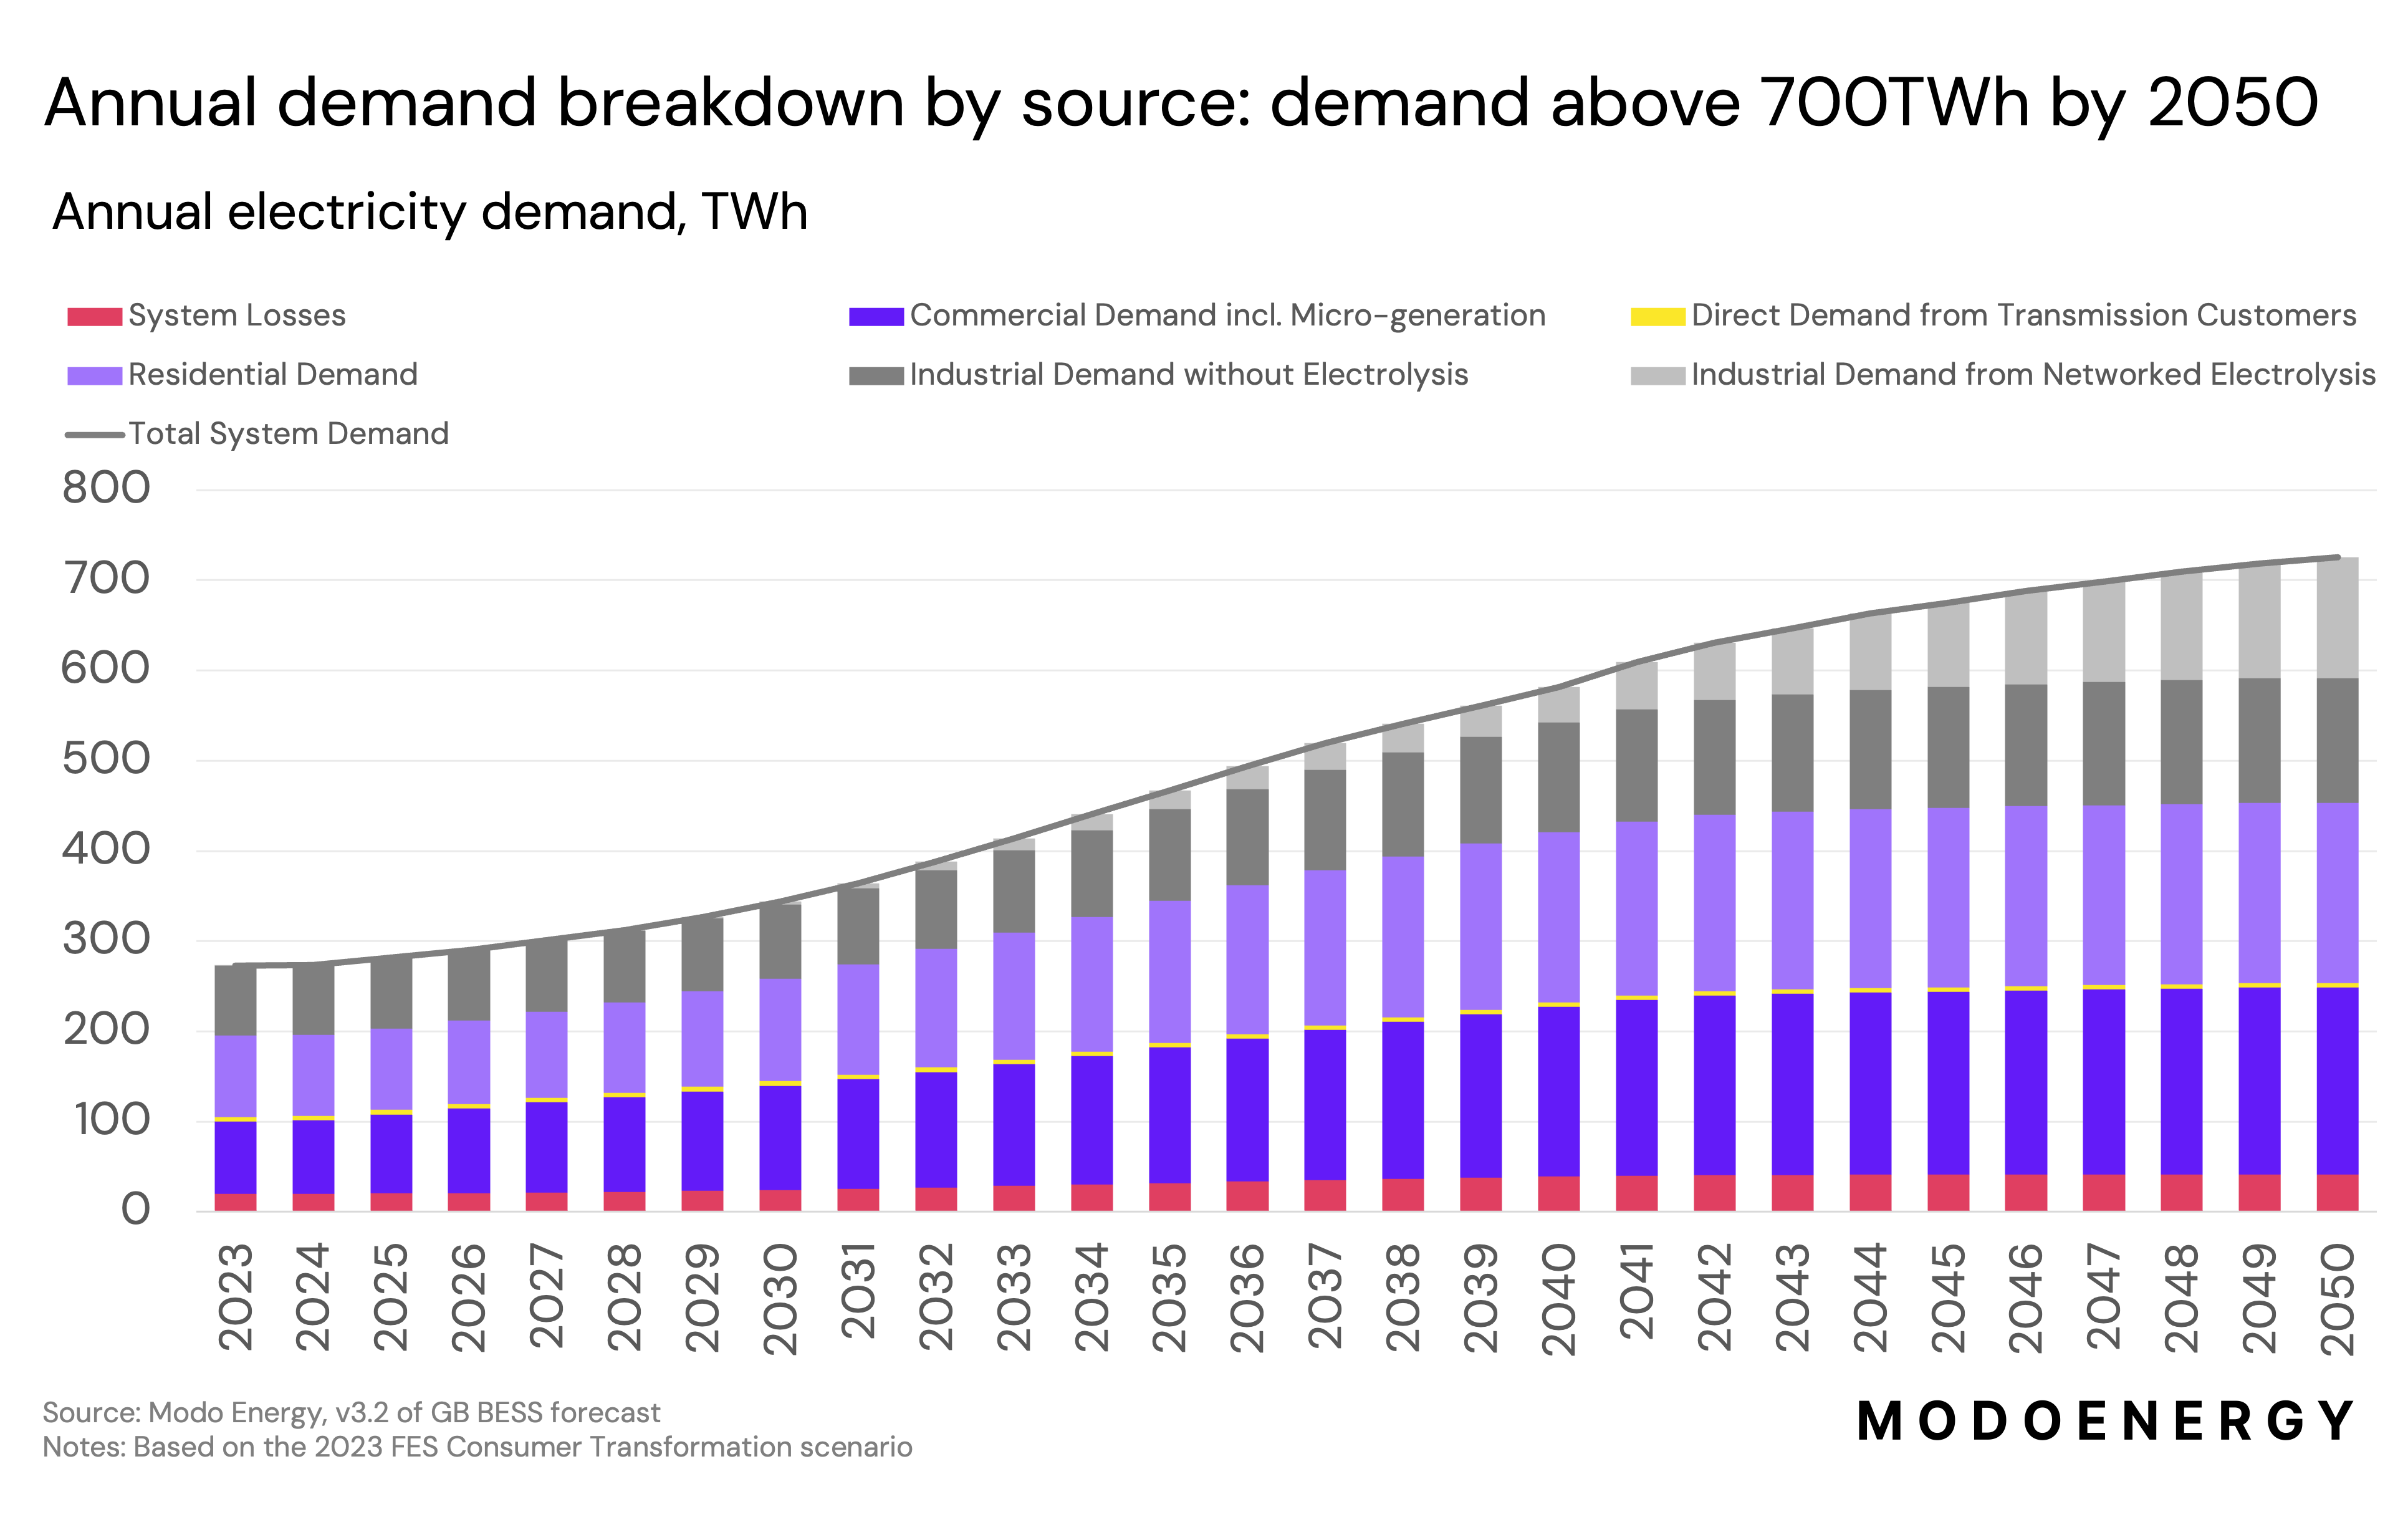
Looking at the sources of demand in more detail
Our headline demand numbers are taken from FES 2023.
The FES 2024, though more recent, is fundamentally different from FES 2023 - with various pathways to net zero, as opposed to scenarios. There is also a significant drop in demand projections in FES 2024, "driven by the need for
FES 2024 to provide a more strategic route to net zero."
We build the Modo forecast for the world we think will happen, rather than we what'd like to happen. So, in v3.2 of the forecast we keep with the Consumer Transformation scenario from the FES 2023.
Updated 8 months ago