
Modelling balancing volumes
We distinguish balancing volumes into system and energy actions.
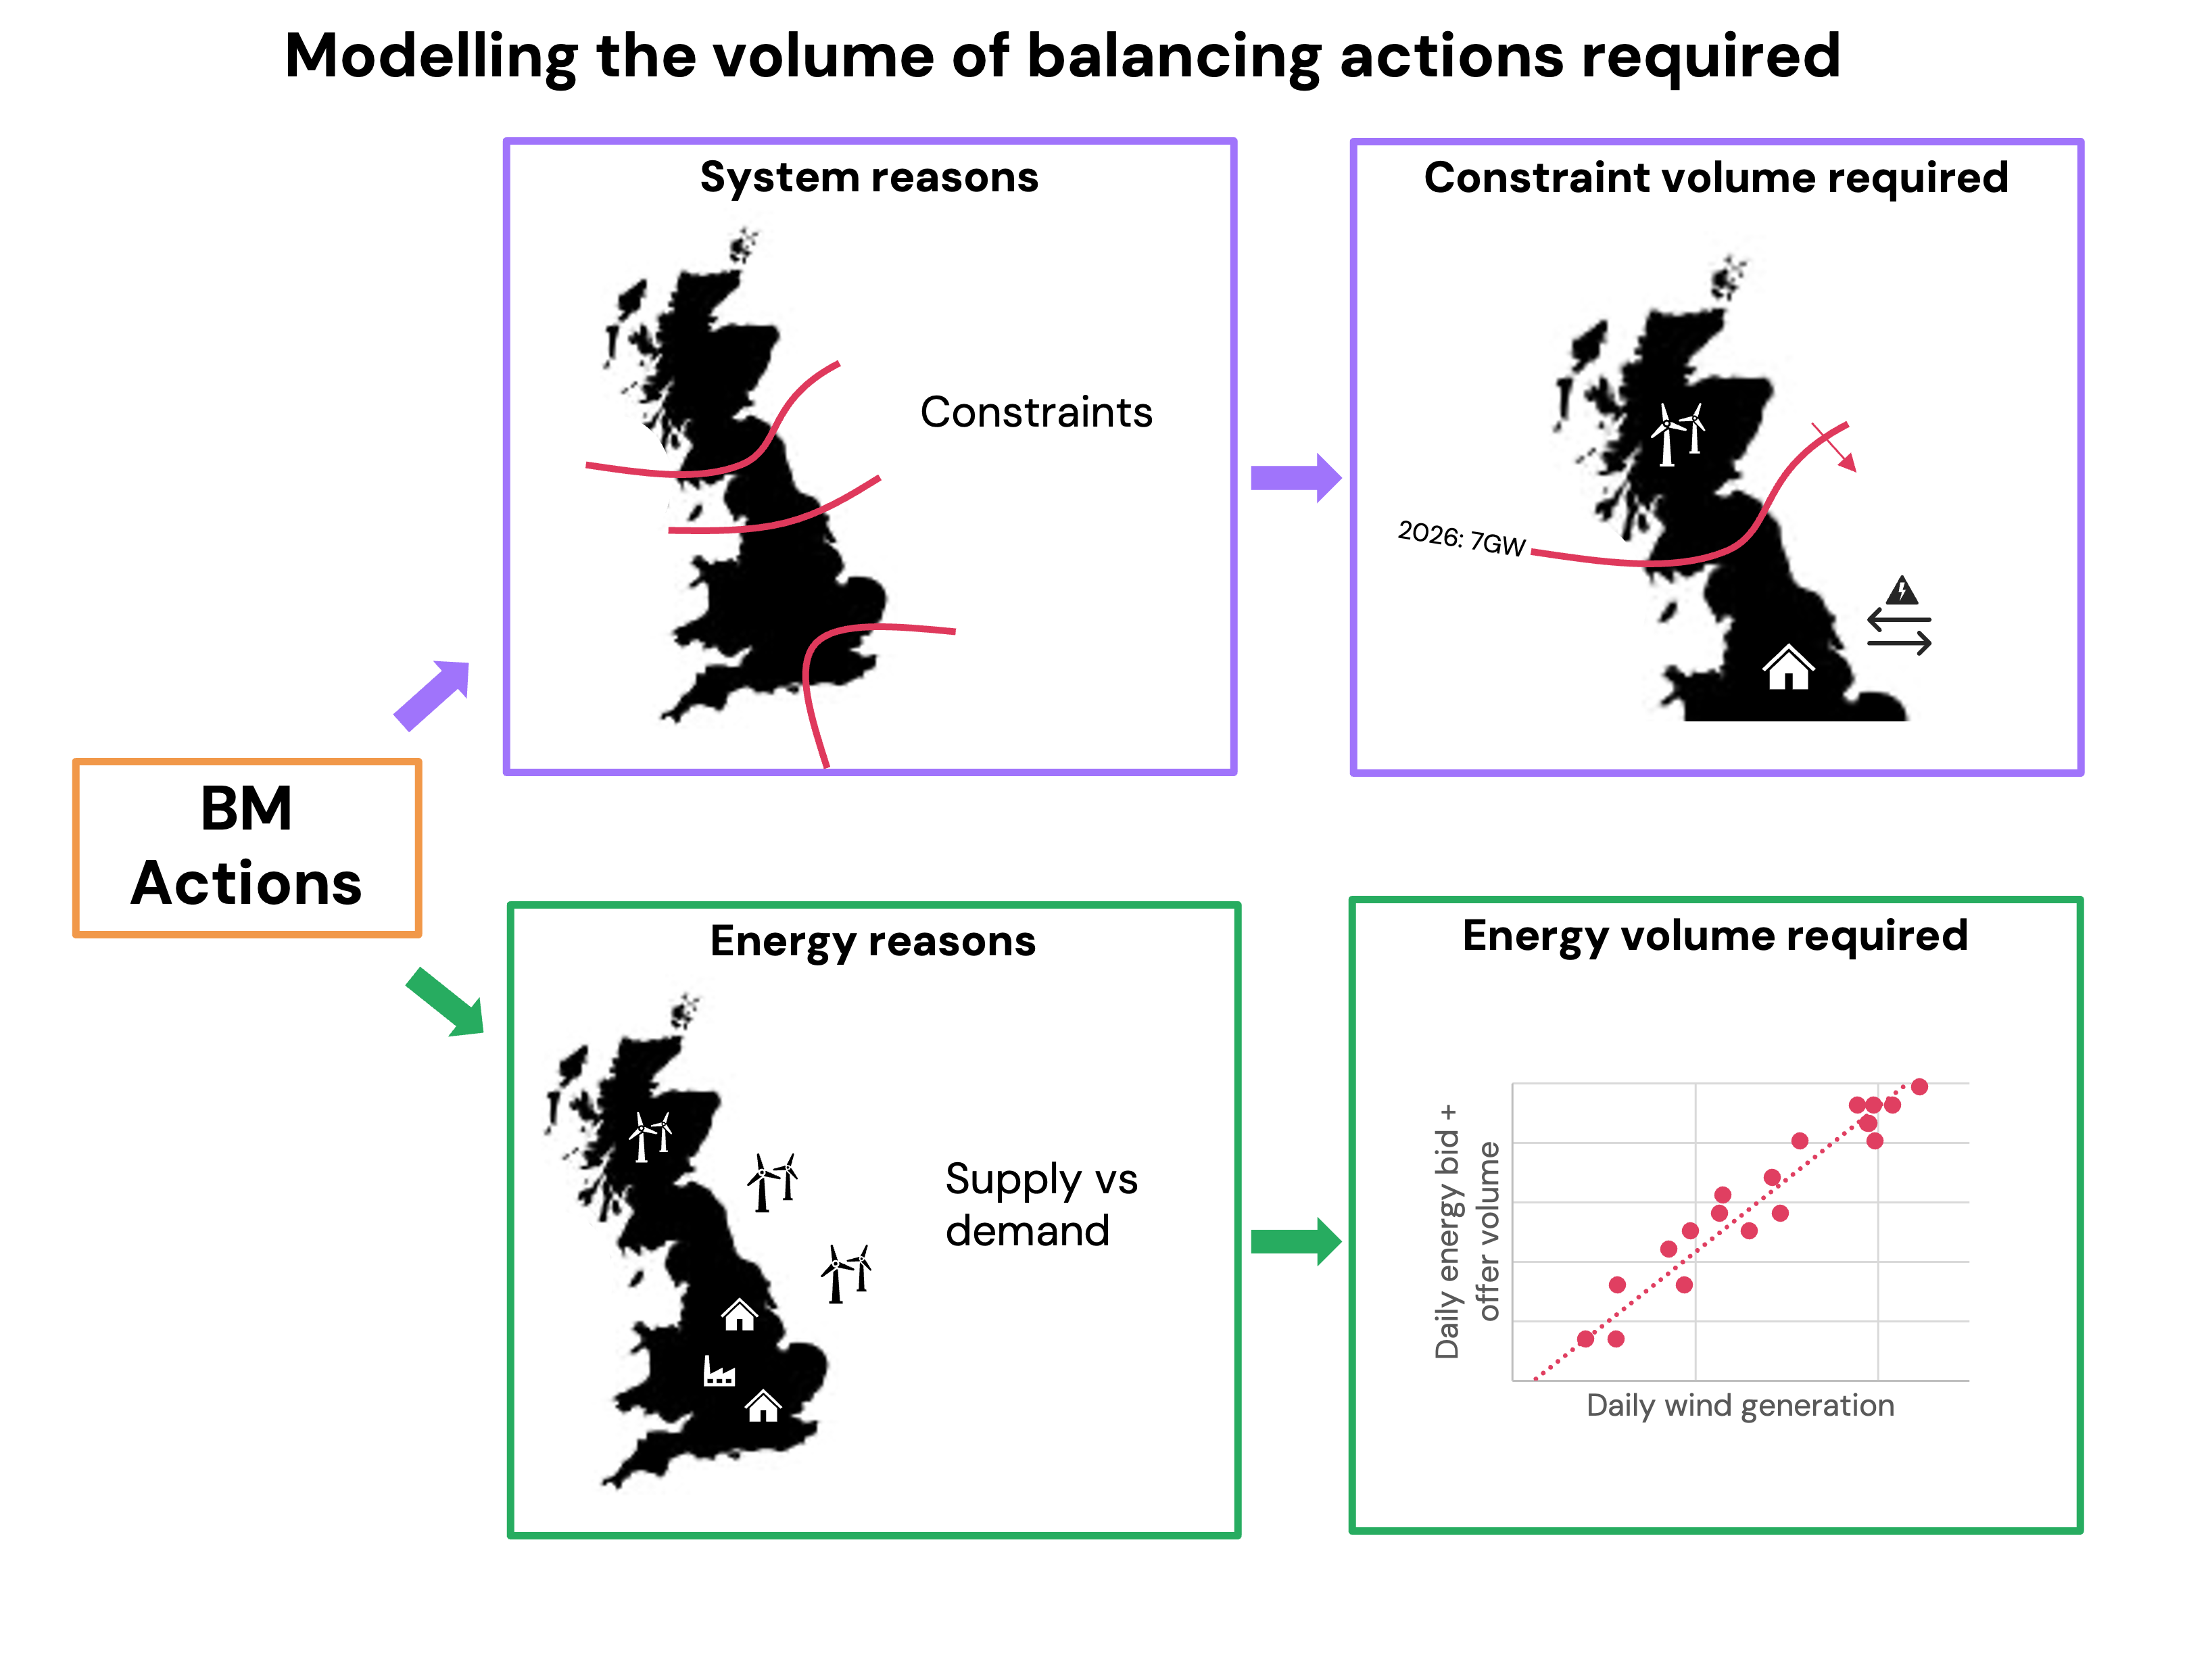
System actions
We estimate the volume (MWh) of actions required to resolve constraints across each major boundary, per half-hour.
The Electricity Ten Year Statement (ETYS) provides forecasts of annual power flows across different network boundaries, considering planned grid expansions. These forecasts include power flows across each boundary at different percentiles, to show how often each boundary is likely to be constrained.
The power flow forecasts are then allocated to half-hourly profiles of wind, demand and interconnector data, depending on whether the boundary is supply, or demand-driven. For example, if a half-hour period has wind generation at the 95th percentile, we assume the power flow across the boundary for that half-hour matches the 95th percentile value from the ETYS for that year.
This method ensures that half-hourly power flows align with expected future network conditions.
To get the volume required of system bids and offers
- Determine if a region is driven by supply or demand. The demand side of boundary is assumed to be the side which contains London. Supply regions are driven by high generation (i.e. wind), e.g. Scotland and East Anglia. Demand regions are driven by load and interconnectors.
- Determine the half-hourly wind, load and interconnector percentiles using the model’s granular supply stacks for each year.
- These percentiles determine the level of flow expected across each boundary (using the ETYS data). Any power flow above the boundary's capacity is attributed to constraint volume.
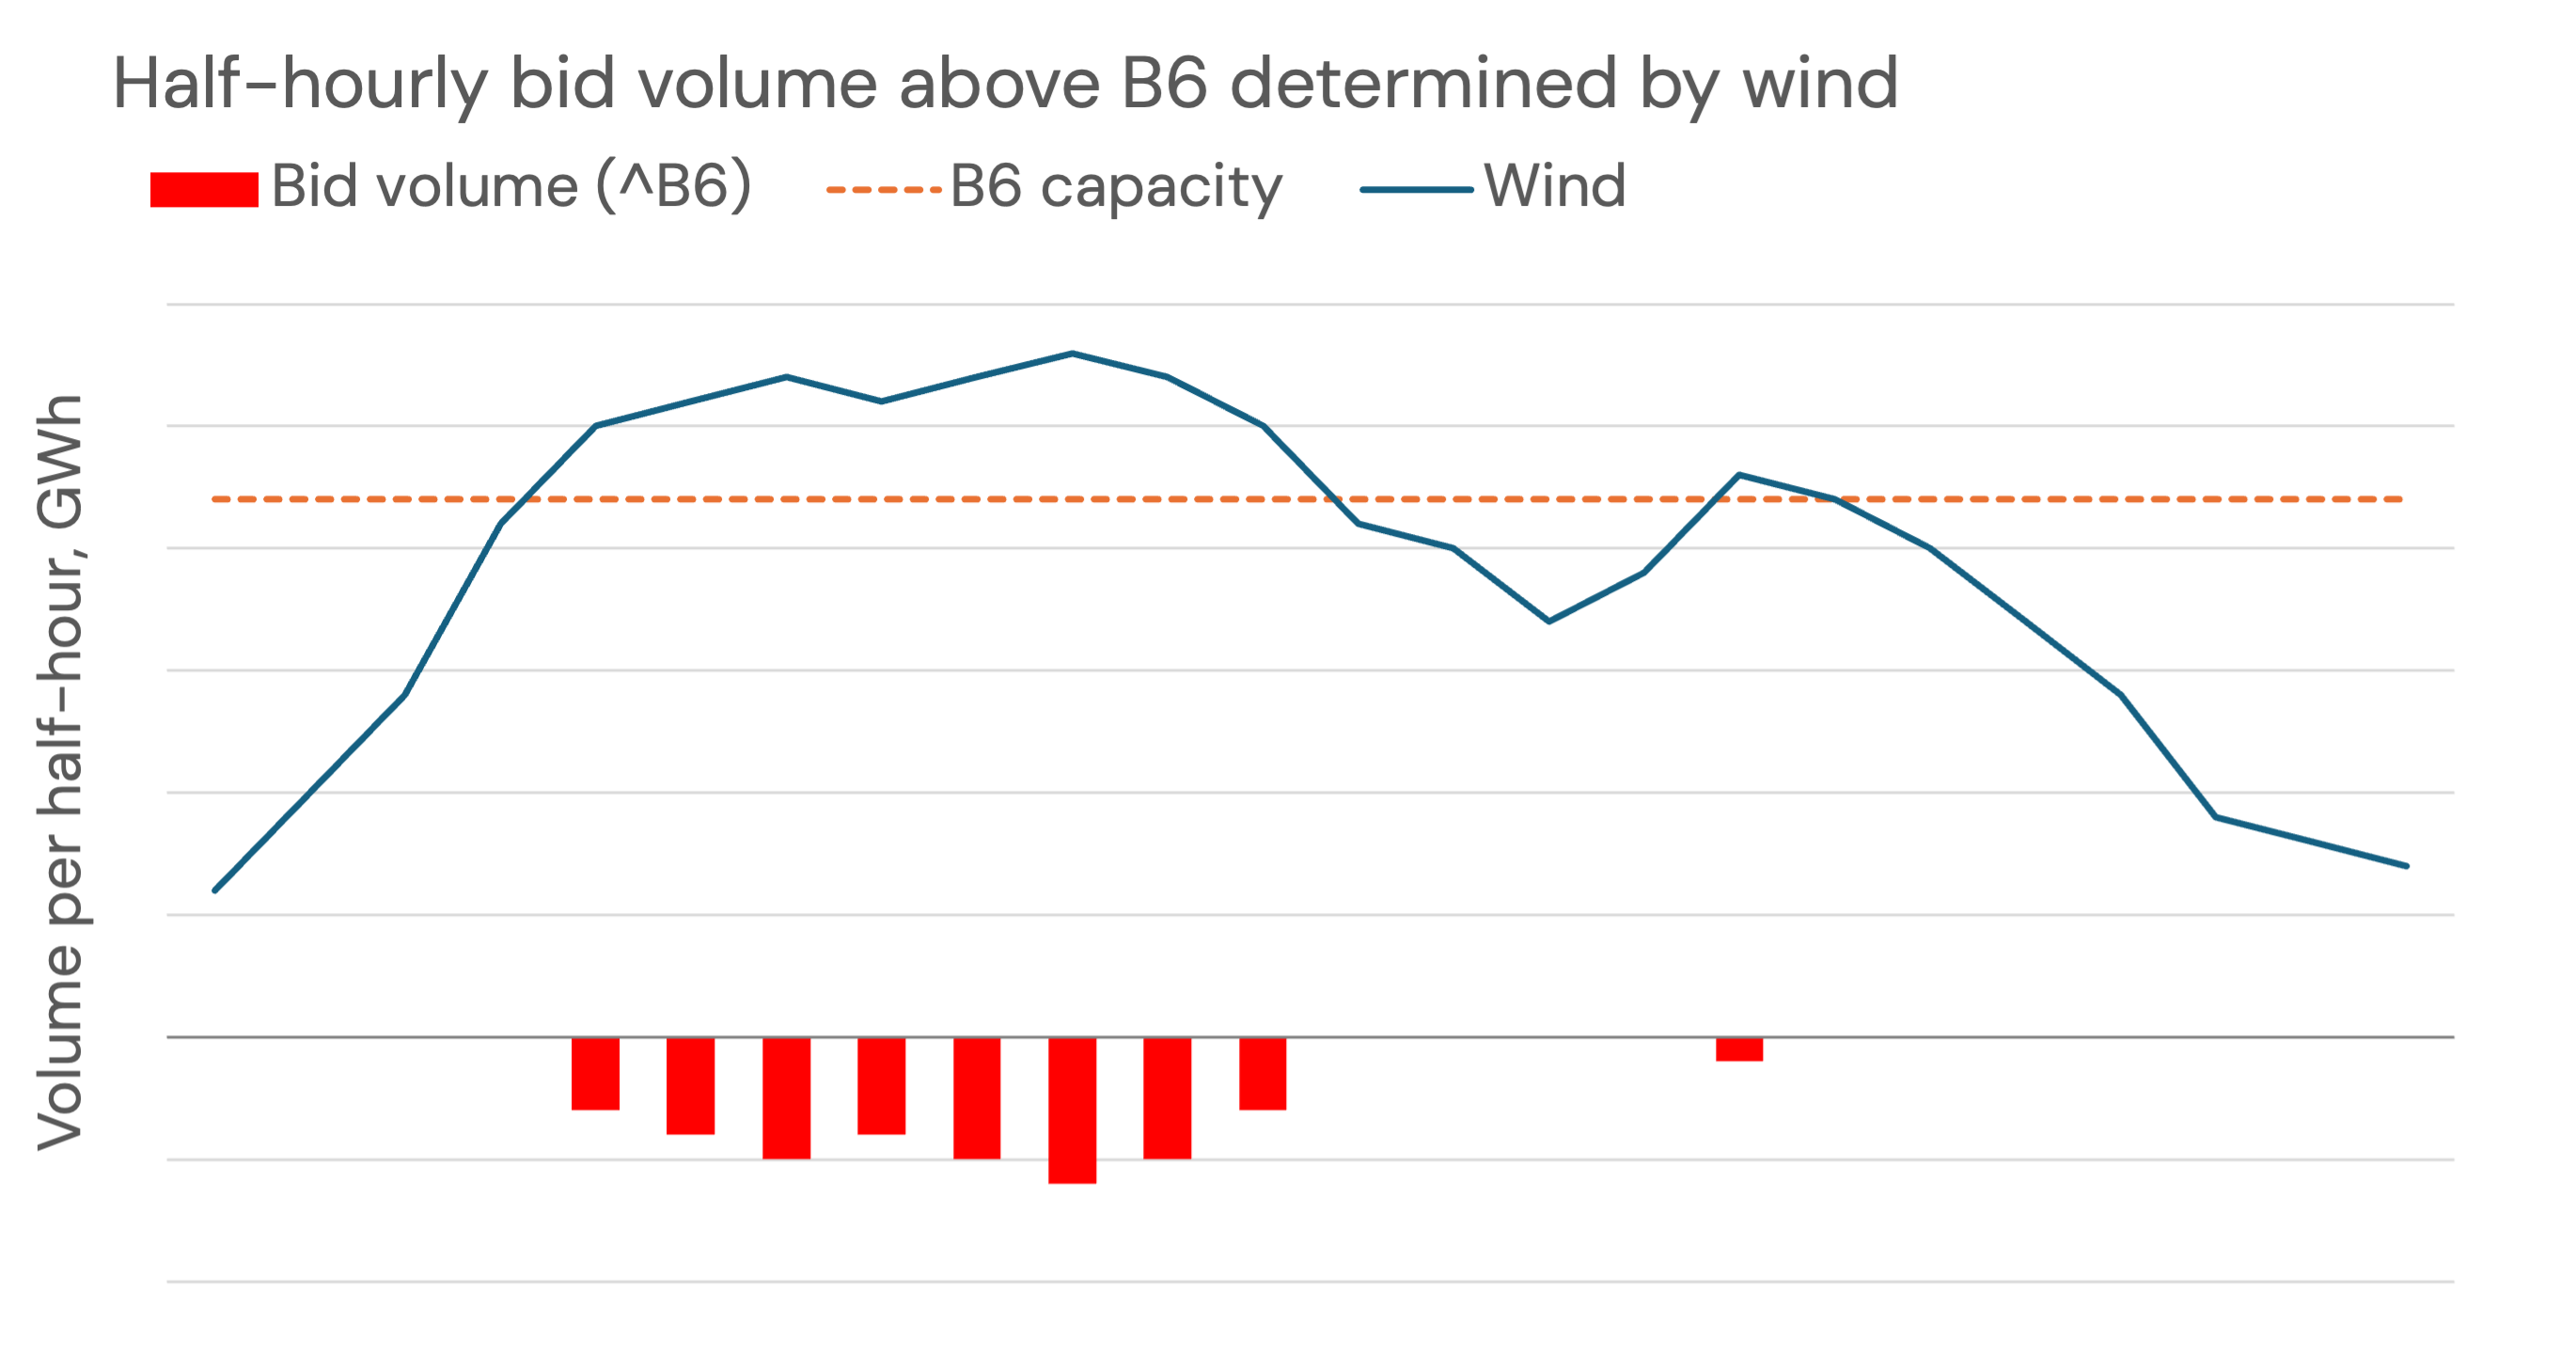
The region above the B6 boundary is supply-dominated, and so half-hourly wind generation determines the constraint volumes required. Numbers indicative only. v3.4 of GB forecast
- In addition, we resolve constraints in Scotland starting in the north and moving south (ie moving from the B2 boundary down to the B6 boundary). This means that any bids taken to resolve constraints at B2 are subtracted from the required bid volume at B4, and so on. This avoids double-counting bids.
We finally arrive at a half-hourly volume required in each region, for both bids and offers.
Energy actions
Historical data shows a linear relationship between the volume of daily wind generation and the amount of balancing volume for energy actions dispatched in the BM.
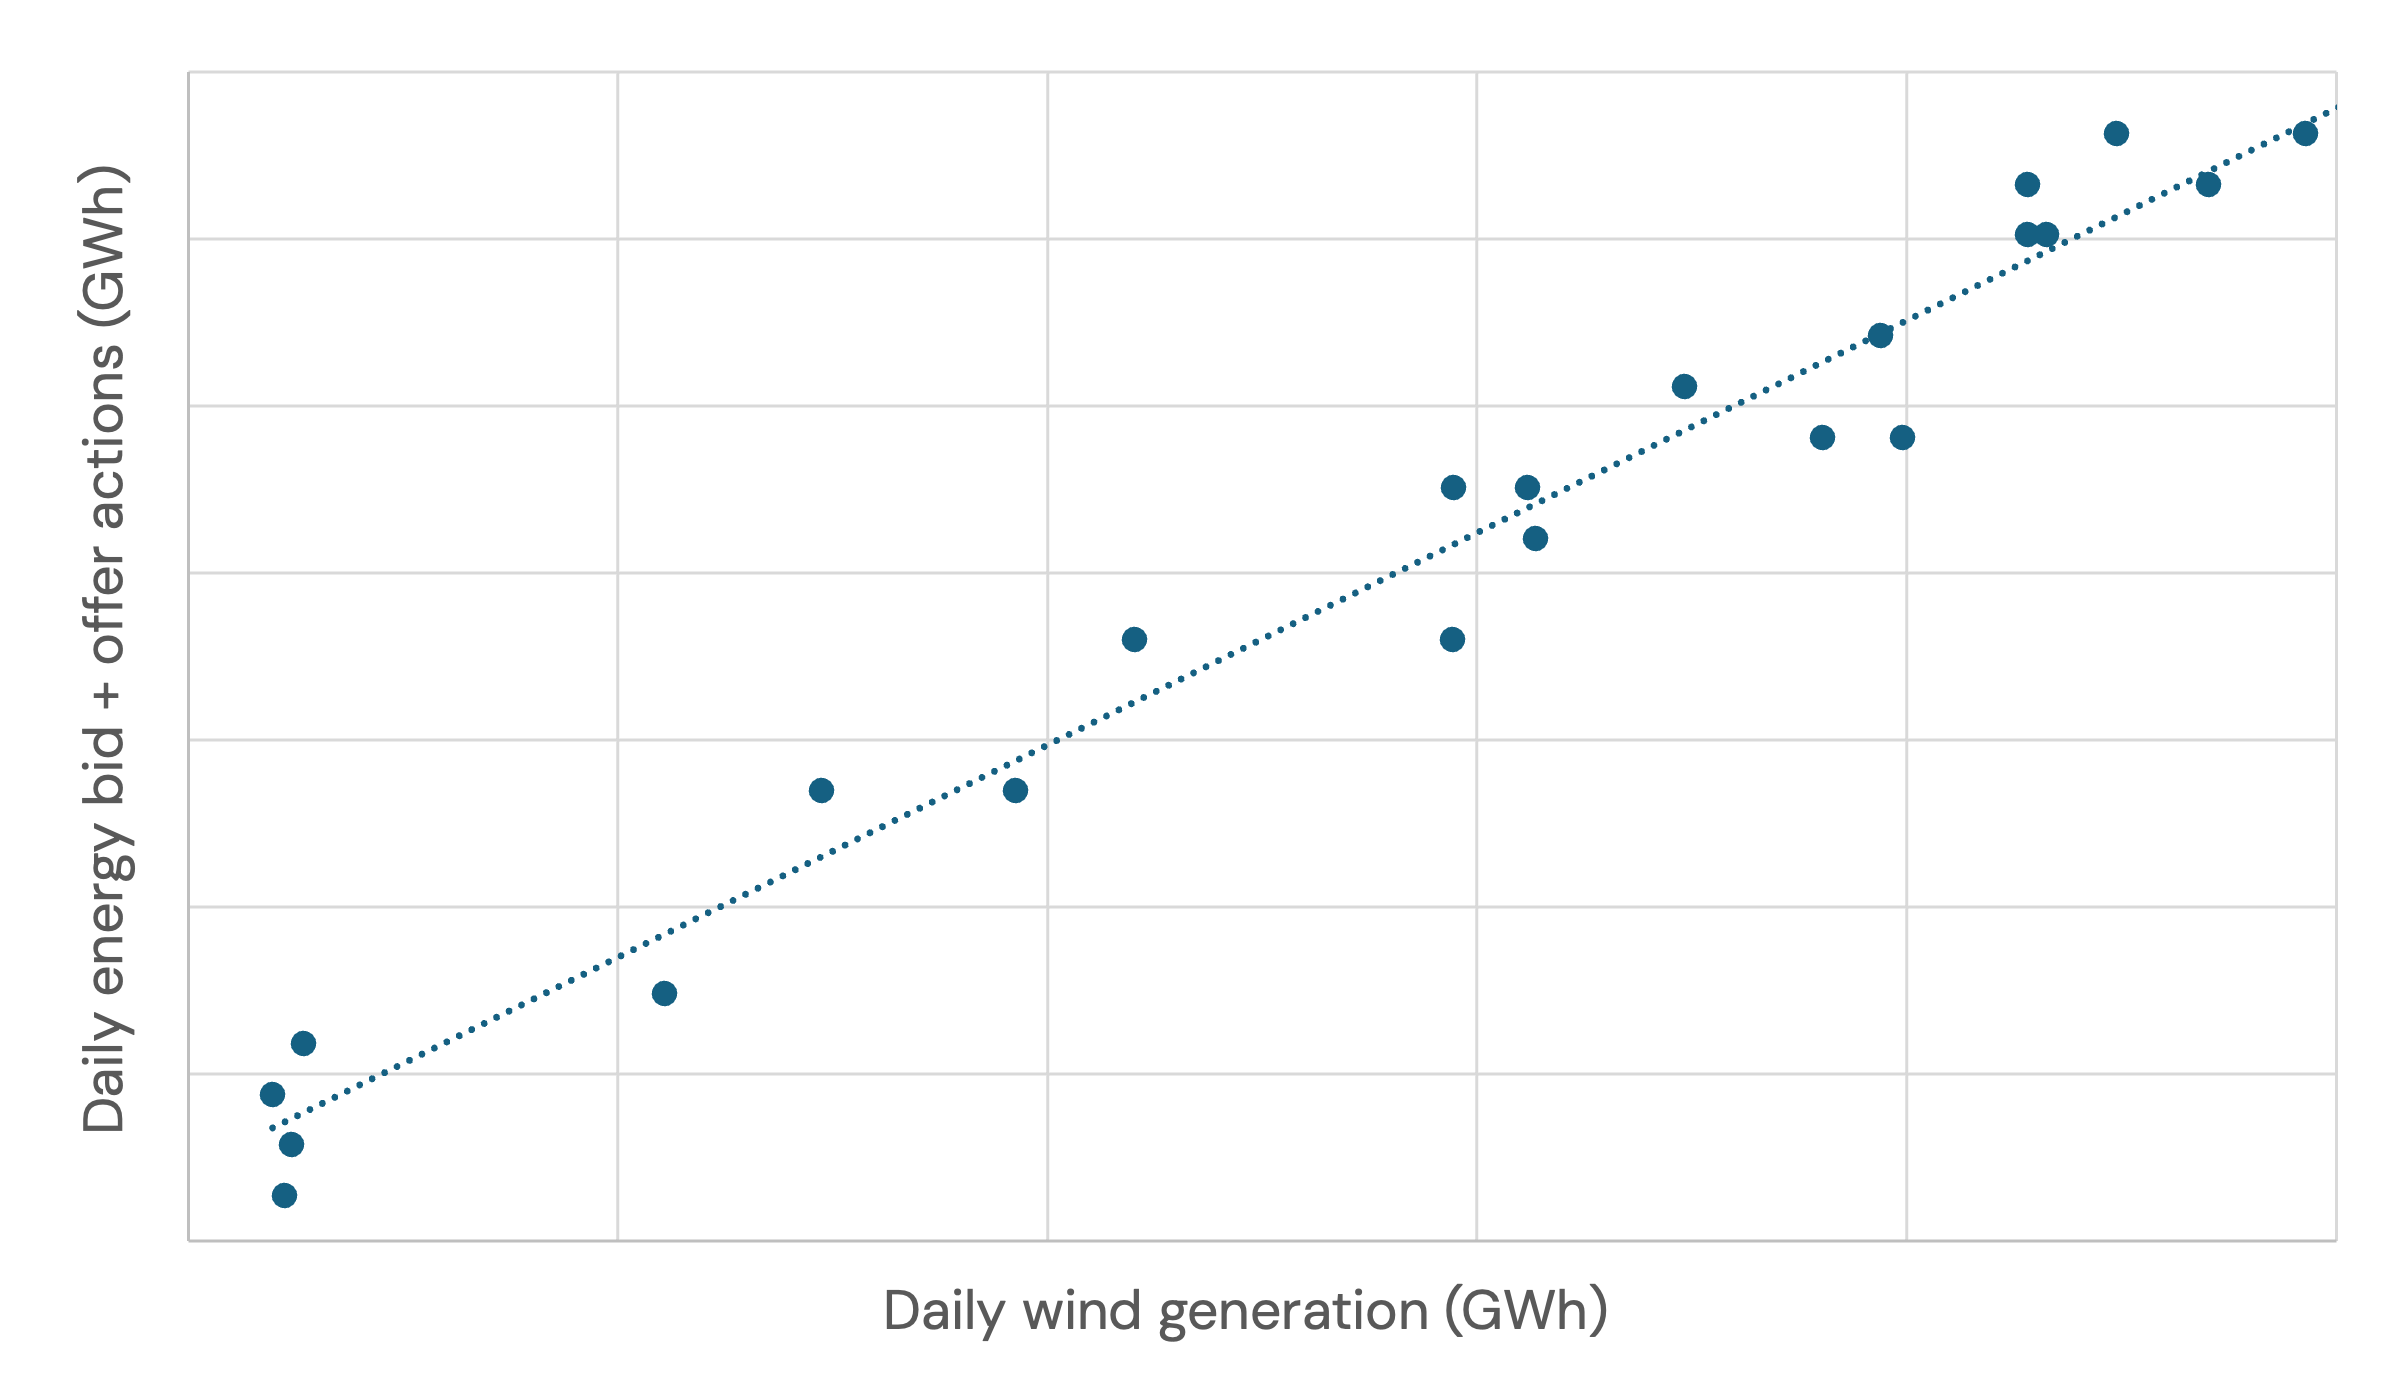
Indicative relationship between daily wind generation and daily total bid and offer volume across 2024. v3.4 of GB forecast
The relationship across 2024 is used to calculate the future daily energy volume required to balance the system (both bids and offers).
The daily energy volume is then split between bids and offers. We assume that on half of the days, the system is ‘long’ (too much generation), and on the other half, the system is ‘short’. On ‘long’ days, there are more bids turning generation down, and on ‘short’ days, there are more offers. Further, we assume 75% of bid-offer acceptances are bids (by volume) on ‘long’ days, and 25% are for offers. On ‘short’ days, 75% of BM energy volume is for offers and 25% for bids. Long and short days alternate.
Updated 9 months ago