
FAQ: Dispatch model
- Why are merchant revenues higher than merchant & ancillary revenues in the forecast?
- Why aren't the revenues of batteries with a 4-hour duration double that of an equivalent 2-hour duration battery?
- Are electricity import costs included in the BESS revenue forecast?
- Why is average cycling shown less than the daily limit of the scenario?
- How do we treat a cycle?
- What is the efficiency and does it include auxiliary load?
- How do you model churn within the model?
- Do you model local flexibility services?
- How do you define maximum continuous time and hourly throughput?
- How does the dispatch model decide how much volume to procure for each ancillary service?
- Do you model planned outages for BESS in the dispatch model?
- Do you model an RTE or round trip efficiency?
Why is the ancillary focus strategy higher than merchant focus in v3.4 of the forecast?
Previously, our Balancing Mechanism dispatch took into account the headroom available for the battery after the day-ahead energy and ancillary commitments. This meant that there were times when a battery would be restricted by a relatively low-value frequency response contract that prevented it from taking high-value BM dispatches. Because of this, revenues were slightly lower in the ancillary focus strategy.
In v3.4, we've given the model some foresight of the Balancing Mechanism opportunity the next day, at the day ahead stage. If it knows that there is a good chance of dispatch in the BM the following day, it will contract less of its capacity into frequency response. This means that frequency response contracts are only used as a slight bump to revenues when the battery wouldn't be doing anything else in the merchant markets. Accordingly, the ancillary focus strategy is now slightly higher than the merchant focus strategy.
Why aren't the revenues of batteries with a 4-hour duration double that of an equivalent 2-hour duration battery?
In wholesale, a 4-hour battery only makes double when high prices are sustained for 4 hours (and low prices for 4 hours), allowing the battery to fully discharge (and charge) during the most advantageous periods.
But, we rarely see such sustained high/low prices.
We might only see a price spike for 1 or 2 hours. A 1 or 2-hour duration battery can make the same revenues on such occasions as a 4-hour system.
Are electricity import costs included in the BESS revenue forecast?
Yes, they are.
Our dispatch model works out when to charge and when to discharge. The revenue in wholesale markets we present is the net of this position.
In our ancillary modelling, we account for the energy cost (or revenue) of importing power to be able to discharge (or charge) in response to low (or high) grid frequency. This reflects the cost of the state of charge management, and is shown in wholesale costs. Given the requirements of the particular service, we limit the state of charge in both upper and lower directions. In addition, we take into account the cost of charging in response to high grid frequency, and discharging when grid frequency is low, using historic data as an input to the expected throughput of each service.
Why is average cycling shown less than the daily limit of the scenario?
Our 2-cycle scenario shows average cycling of less than 2 cycles per day. Why?
Our cycling is limited to a maximum of 2 cycles per day (for example). It will only do this when economical - on many days, there aren't the price spreads to warrant the additional cycling. So, overall, the average comes out less than 2 per day.
The average spread that an asset captures are shown below, for a 2-cycle and 2-hour system.
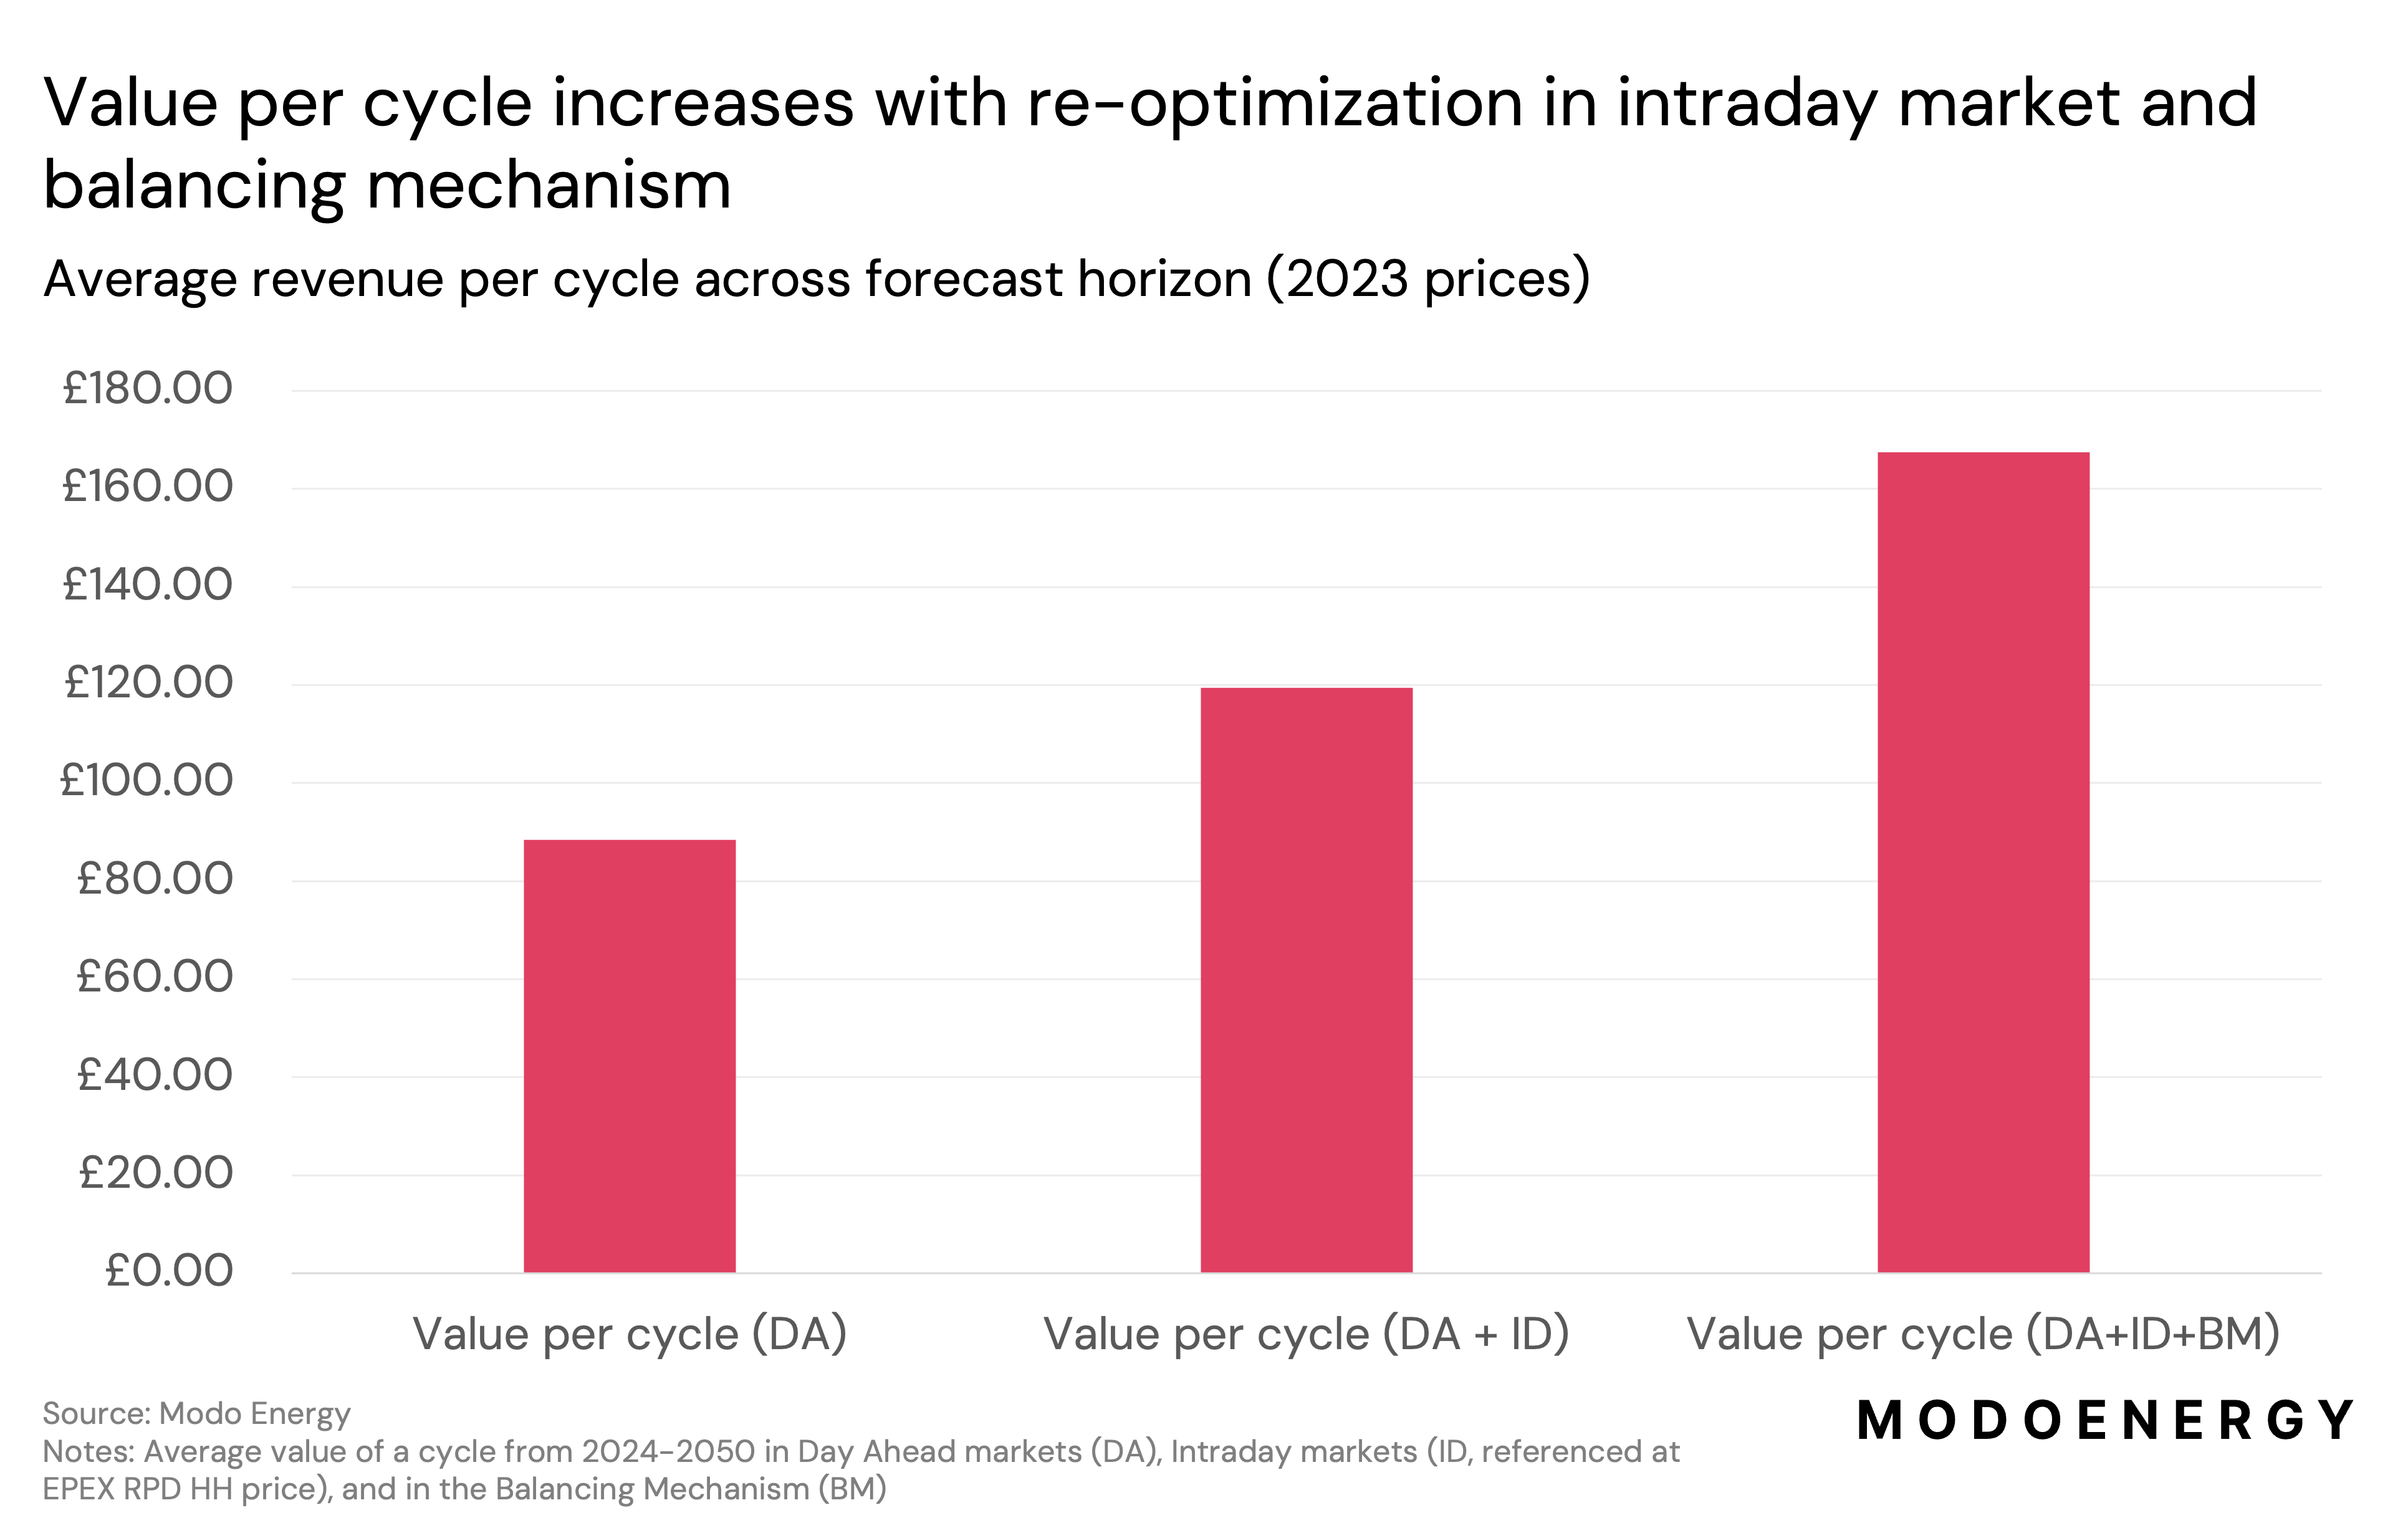
We have no minimum threshold for cycling the battery in our optimisation, only require the action to be economical. This means any spread must at least compensate for efficiency losses in the charge/discharge action. Average revenues per cycle across the forecast horizon are shown below.
How do you treat a cycle?
One cycle is defined as the energy throughput of a battery relative to the degraded capacity of the site. This means that the throughput required for one cycle will decrease as a battery degrades.
Cycling is defined like this to be aligned with many battery warranties.
Cycles in the forecast spreadsheets consider battery actions within the day-ahead and frequency markets. The cycling is then topped up to the maximum number of cycles permitted per day in the Balancing Mechanism (when it is profitable to cycle here).
What is the efficiency and does it include auxiliary load?
The standard efficiency is 88%, but you can tailor this if you create your own forecast. Yes, it includes auxiliary load.
A rough breakdown of efficiency losses that are included in this overall round trip efficiency:
- 2% losses for cells
- 4-5% for power conversion (through the inverters, 2-2.5% each way)
- 2% balance of plant/site distribution/transformers
- 2-3% auxiliary load
Because the standard efficiency we use takes into account all of these losses, for 'Battery Capacity (MW)' in bespoke forecasts, uses should enter the nameplate capacity (MW) (as opposed to DC or AC capacity).
If the AC grid connection differs from this, then we advise entering in the AC capacity for import or export site limts.
How do you model churn within the model?
We allow for churn, or non-physical trading, when re-optimising the battery in intraday and the Balancing Mechanism.
This is part of our 3 step optimisation approach: 1) optimise in day-ahead wholesale and frequency response markets, 2) re-optimise in intraday with imperfect foresight and a rolling time horizon, 3) accept Bids and Offers in the Balancing Mechanism based on locational dispatch rates and perform any required rebalancing.
More information on our intraday modelling assumptions can be found here and Balancing Mechanism here.
Do you model local flexibility services?
Not yet.
Local flexibility services are highly locational, and usually have small contract sizes (MW). So far, two utility-scale batteries have tendered into local flex markets. While the volumes each Distribution Network Operator has procured of local flex (which might be upward or downward flexibility) has been growing, it is still quite small.
More info on local flexibility services for grid-scale battery storage here.
How do you define maximum continuous time and hourly throughput?
Maximum continuous time is the maximum duration for which a frequency response provide must be able to output its maximum contracted power, e.g. for contracted 5 MW in DCL you need to be able to export 5 MW for 15 minutes. However, this is very rare and would involve a sustained frequency deviation of 0.5 Hz.
Hourly throughput is average energy exported/imported per MW contracted in Low/High frequency response per hour. We calculate this using historical grid frequency data, and use it to quantify the battery's state-of-charge whilst it provides frequency response.
How does the dispatch model decide how much volume to procure for each ancillary service?
The dispatch model decides based on what maximises total revenues. For example, if doing a combination of ancillary services and wholesale maximises revenues, then the dispatch model will decide to procure less ancillary volume so that it has available capacity for wholesale trading. Whereas, if wholesale spreads are low then it will decide to procure greater ancillary volumes.
We also limit the maximum volume that can be procured in each ancillary service based on market saturation. The dispatch model decides how much volume to allocate, which must lie within 0 and this saturation limited maximum.
Do we model planned outages or curtailment for the BESS in the dispatch model?
We assume full availability of BESS in the dispatch model. However, when we calibrate the forecast battery revenues to real-life battery revenues, we capture the impact of all of the grid-scale batteries real-life availability (amongst other things, like perfect foresight of the forecast values in the dispatch model optimisation, and the likelihood of winning an ancillary service contract).
In custom runs, we can offer curtailment modeling. This works best if you have an idea of any restrictions on the grid connection or battery output. For example, if you know your site is planned to be out for three months next summer, we can incorporate this into our revenue projections (and you won't get any revenue for those three months).
Alternatively, the site might be subject to active network management actions in the summer months when solar output is high, preventing it from exporting power during those times. By supplying us with a profile of what that active network management profile is likely to be, we can incorporate it into the modeling.
There is a bit more info on active network management here.
Do you model an RTE or round trip efficiency?
Yes. By default, RTE is 88%. This is configurable in custom runs.
This value refers to efficiency measured at the PoC including auxiliary losses. It includes all system losses - from cell-level inefficiencies through to power conversion, balance of plant losses and auxiliary consumption.
In our model, efficiency losses are applied during the charging phase. For example, with a default efficiency of 88%, a 2-hour duration, 50 MW battery system would discharge fully at 50 MW for 2 hours (100 MWh total output). To achieve this, the system needs to charge up approximately 113 MWh, meaning that if charging at full rated power (50 MW), the charging duration would be approximately 2.3 hours.
Updated 4 months ago