
Forward curves
You can also subscribe to the Modo Energy 3-year, hourly forward curves. These are accessible on the Modo platform via both the Data Downloads page and the API.
These are different from the rest of the battery forecast, as they show the forward market on any one day.
We show the current forward traded price for power, on the forward markets (both over the counter and exchange) at hourly granularity, for the next 3 years.
We have taken all the different forward products (like 'Winter 23', 'Q1 24', 'next month', 'January peaks' etc (there's quite the list) and brought them together. We add shape based on some time series analysis for differences in price across the day (including bank holidays, winter Thursday's at 5 pm, etc etc) and calculate one single price of energy per hour, for the next 3 years.
Why have we built our own forward curve?
We think it's easier to look one single price for each time period, rather than looking across many different products and working out which ones cover the period you're after and getting the average price from them.
And, it's needed to value flexibility. Flexible assets like battery storage need daily price volatility. Only peak (12 hours) and base (24 hours) products are available on the more traditional curves: these aren't granular enough.
All energy trading teams will have their 'own' in-house forward curve which they use to value PPAs, or flexible assets, and price tolls... essentially to work out whether they think buying or selling power for a certain price is good or bad for their overall position.
So Modo have built one to help our users make similar decisions.
What's the latest value of the flexibility of your asset on the markets, right now?
The curve is at hourly granularity so it can be used to value batteries. Wondering what your optimisation strategy could yield in wholesale markets this summer? Wondering what the current LNG strikes in Australia could do to your battery revenues next winter? Is the floor you've just got from an optimiser tender good value? How much would you expect from your wholesale trading strategy in the next few months?
Stepping away from batteries, is the solar PPA you've just been offered reasonable, given the capture rates you'd expect (and maybe go have a look at the Sheffield Solar data as well to work that one out). Or, looking at the bigger picture, how is next winter trading?
It's not a forecast, it's a forward curve
One should be very careful to realise the difference between a forecast of price and a forward price. However, if you have reason to believe that power should be valued differently in the future, you should go and trade that position.
It's updated every weekday
Using the latest prices at the end of each day across all the forward products. We work with a third party to get a view of the latest happenings in both over-the-counter (OTC) and exchange trades, and update the forward curve each day once trading has closed.
Why not weekends? As the markets don't trade then. For the same reason, there is no data for bank holidays.
So, what does this data look like?
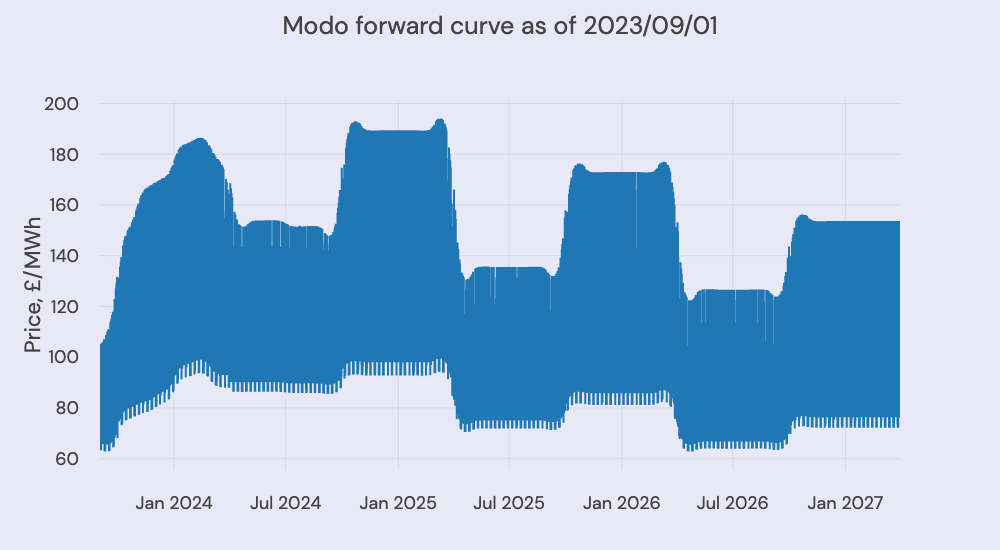
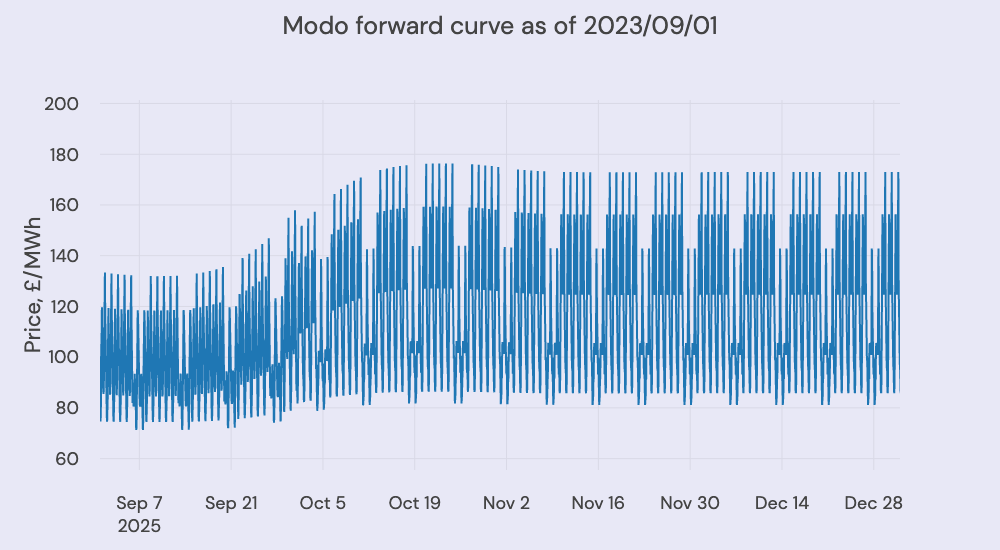
And zooming in,
How has this changed over time?
Updated 8 months ago