
Transmission constraints for the BM
TLDR; network constraints will become more severe and location will impact battery revenues
100's of GW of new-build generation will come online over the next 25 years and with that, a build-out of HV wires in the transmission network to carry the power they generate.
Most of the wind is (and will be) in the North of GB, and the demand is concentrated much further South.
We model the locational buildout of both energy assets and transmission infrastructure to work out constraint levels on the network out to 2050, and use this to estimate Balancing Mechanism revenues for system actions.
Using daily wind generation, we estimate Balancing Mechanism revenues for energy actions.
Assets in Scotland, north of the B6 (and other boundaries that sit above it), will see huge bid levels. London and the South East will see huge offer levels. Relative bid and offer volumes change over time as new wires get built. Competition for bids and offers from different energy assets change over time, and are modelled.
Using the Electricity Ten Year Statement, and the Regional Future Energy Scenarios, we model each transmission boundary over time.
Data from the Electricity Ten Year Statement lets us model the constraint levels expected at each transmission boundary over time.
Currently, the largest constraint in Great Britain is the B6 constraint. High levels of wind generation in Scotland need to move across the border towards the demand centers in England. The B7a would be similarly constrained, however, both boundaries can be simultaneously resolved by bids North of the B6 and offers South of the B7a.

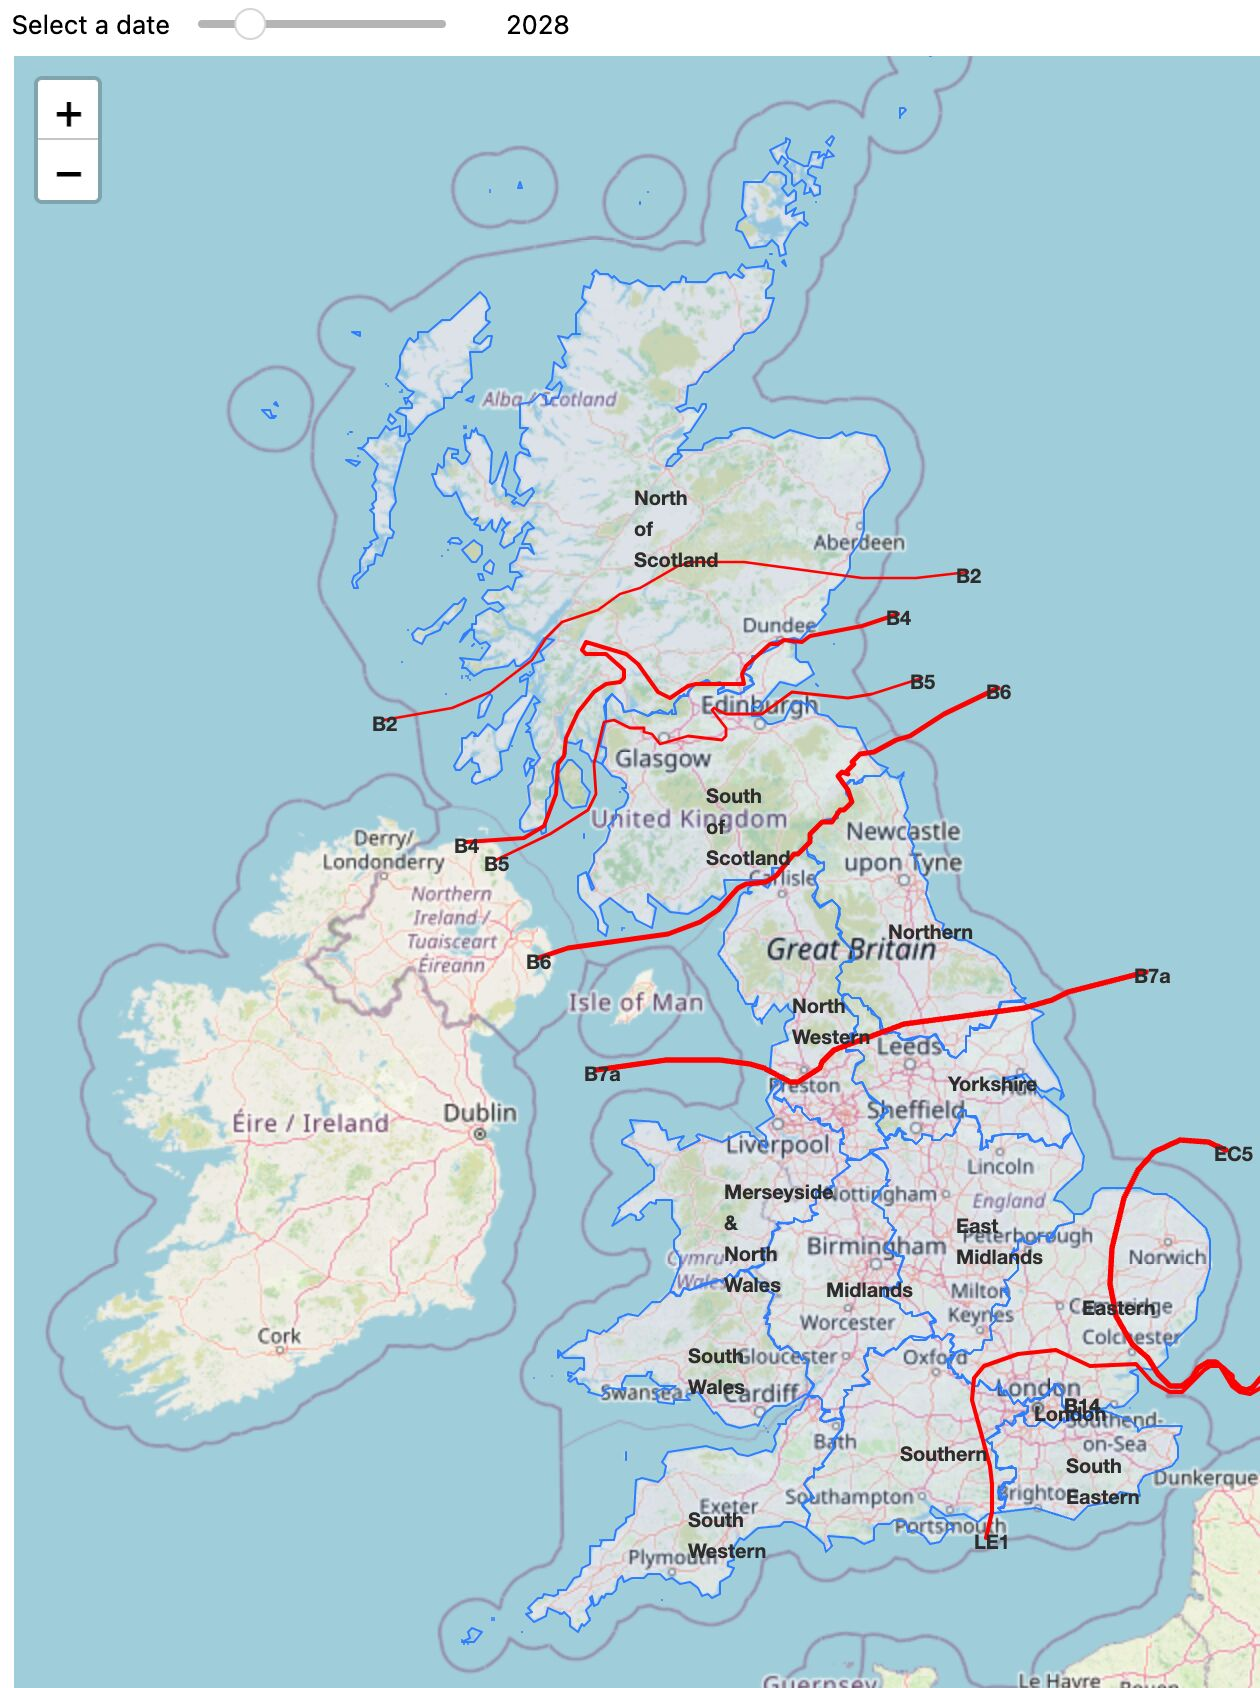
By 2028, this will look quite different. There will be more constraints in Scotland as well as in the East of England (due to wind generation) and the South East of England (due to interconnectors and high levels of demand). There will then be considerable constraints further North in Scotland than the B6, bringing more bids North of the B2 boundary.
After 2028, constraints in Scotland continue to increase. These constraints become higher up in Scotland due to more offshore wind generation being connected to the grid further North.
By 2033, transmission improvements will mean the situation returns to a similar situation to today, with the B6 once again being the dominant constraint.

We have made adjustments to the Electricity Ten Year Statement data in later years as it would otherwise lead to unrealistically high constraints in Scotland, particularly at the B2 boundary. In reality, the cost of building more transmission in the area would be cheaper than the cost of balancing the system, so we have increased the assumed level of transmission capability in Northern Scotland. We model the annual volume of BM system volume, by boundary, out to 2050.
We use half-hourly demand, and wind, to model granular constraint levels
Constraints at the B14 boundary (London) are greatest when there is high demand. Constraints at the LE1 boundary (South East England) are greatest when there is high demand and interconnectors are exporting. Generally, the other constraints are greatest when there are high levels of wind generation. For more information on the impact of location, including an interactive map, see the Location section.
We map expected constraint levels at each boundary to the volumes we expect to be required to balance each constraint in the BM, based on historical analysis.
Finally, we have looked at the level of competition for the bids and offers to address these constraints, based on the location of dispatchable assets over time.
This then gives us a dispatch rate for a given location for each half-hour, which can be combined with bid/offer availability and bid/offer prices to calculate BM revenues.
In the constraint modeling, do you assume any future outages on the transmission network?
The actual performance of the boundaries we model is not 100%.
While we don't explicitly model outages, we account for them implicitly by using historic data to calibrate the model.
The Electricity Ten Year Statement is used to work out what flows we expect across each boundary for every half-hour period. This is compared with the theoretical capability of each boundary to calculate how constrained the boundary will be.
A mapping is then used to get from how constrained the boundary is to the BM volumes needed to address that constraint. The mapping is based on looking historically at the relationship between the theoretical capability of the B6 and the BM volumes needed to address B6 constraints. The B6 is not always operating at full capability, so this model accounts for outages.
In doing this, we assume:
- Outages on all boundaries are similar to what the B6 has had over the last couple of years.
- The relationship between the constraint level of a boundary and the BM volumes needed to address it is the same for each boundary.
This might not be the case, but the fact the B6 is currently the only significant constraint makes it impossible to do anything different.
Updated 8 months ago