Capacity Expansion Model v3
The Capacity Expansion Model relies on the calculation of cashflows for individual plants. These are used to determine new-build, retirement and retrofit decisions.
Before calculating cashflows, we get estimates of CapEx and fixed OpEx values for each technology.
This represents a feedback loop of capacity market revenues, build-out, and wholesale market revenues for gas CCGTs, OCGTs, gas recipts, and battery storage.
CapEx and OpEx numbers come from NREL
We rely on the latest NREL numbers for CapEx and fixed OpEx (the Electricity Annual Technology Baseline dataset). These are used to calculate cashflow, NPV (Net Present Value) and IRR (Internal Rate of Return) values.
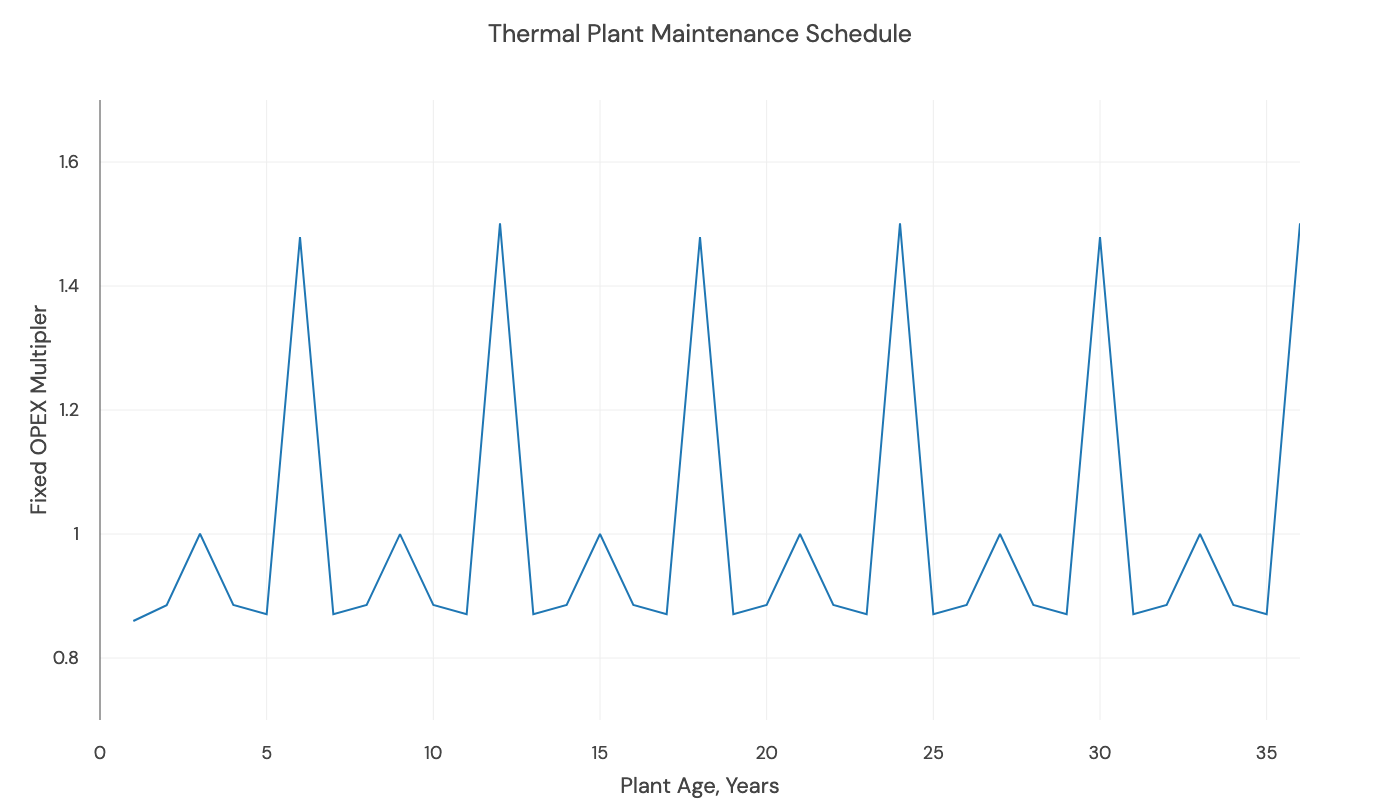
We use NREL data for each technology's fixed annual operational cost (OpEx). Next, we add scheduled maintenance - some years will require more maintenance than others. For example, we expect the most significant CCGT OpEx cost to be major inspections and overhauls of the gas turbine, which are typically undertaken every sixth year. So, for CCGTs, OCGTs, and Gas Reciprocating Engines, we take the fixed OpEx value and scale it by a maintenance schedule, as below. This uses the start year of each plant to assess when the significant cost will fall.
Once we have fixed OpEx and CapEx values, we can calculate cashflows.
We calculate cashflows (£/MW) for each year from 2029.
Calculated cash flows are used to inform new-build, retrofit, and retirement decisions.
Cashflows = Wholesale Revenues + Capacity Market Revenues + Balancing Mechanism Revenues + Ancillary Service Revenues - Fixed OpEx - Variable OpEx
Where:
- Wholesale Revenues are calculated separately for batteries, and for all other technologies:
- For batteries: Wholesale Revenues are estimated using a linear regression model correlating daily power price spreads with battery revenues.
- For all other technologies: Wholesale Revenues are calculated as (Power Price x Generation x (1 - Enforced Outage Rate)) / Generation Capacity .
- Here, Enforced Outage Rate reflects the reduction in revenues from outages and scales with the number of cold, warm, and hot starts for the technology. The Enforced Outage Rate resets based on the aforementioned maintenance schedule.
- Capacity Market Revenues are calculated as Capacity Market Derating FactorxGeneration Capacity
- Balancing Mechanism Revenues are taken as a multiple of wholesale revenues
- Ancillary Service Revenues are set to £2.50/MW for CCGTs and £15/MW for OCGTs and Recips. This is based on analysis by CRA.
- Fixed OpEx is calculated by multiplying the maintenance schedule by a base fixed OpEx, as described above.
- Variable OpEx is set as the short-run marginal cost of the technology.
New-build, Retrofit, and Retirement Decisions are technology-specific
Given our net-zero goals and current commercial realities, we decide on the changing capacity mix that depends on the type of generator. Hurdle rates for NPV and IRR calculations are based on analysis by Europe Economics, with adjustments made to account for higher interest rates since this was published.
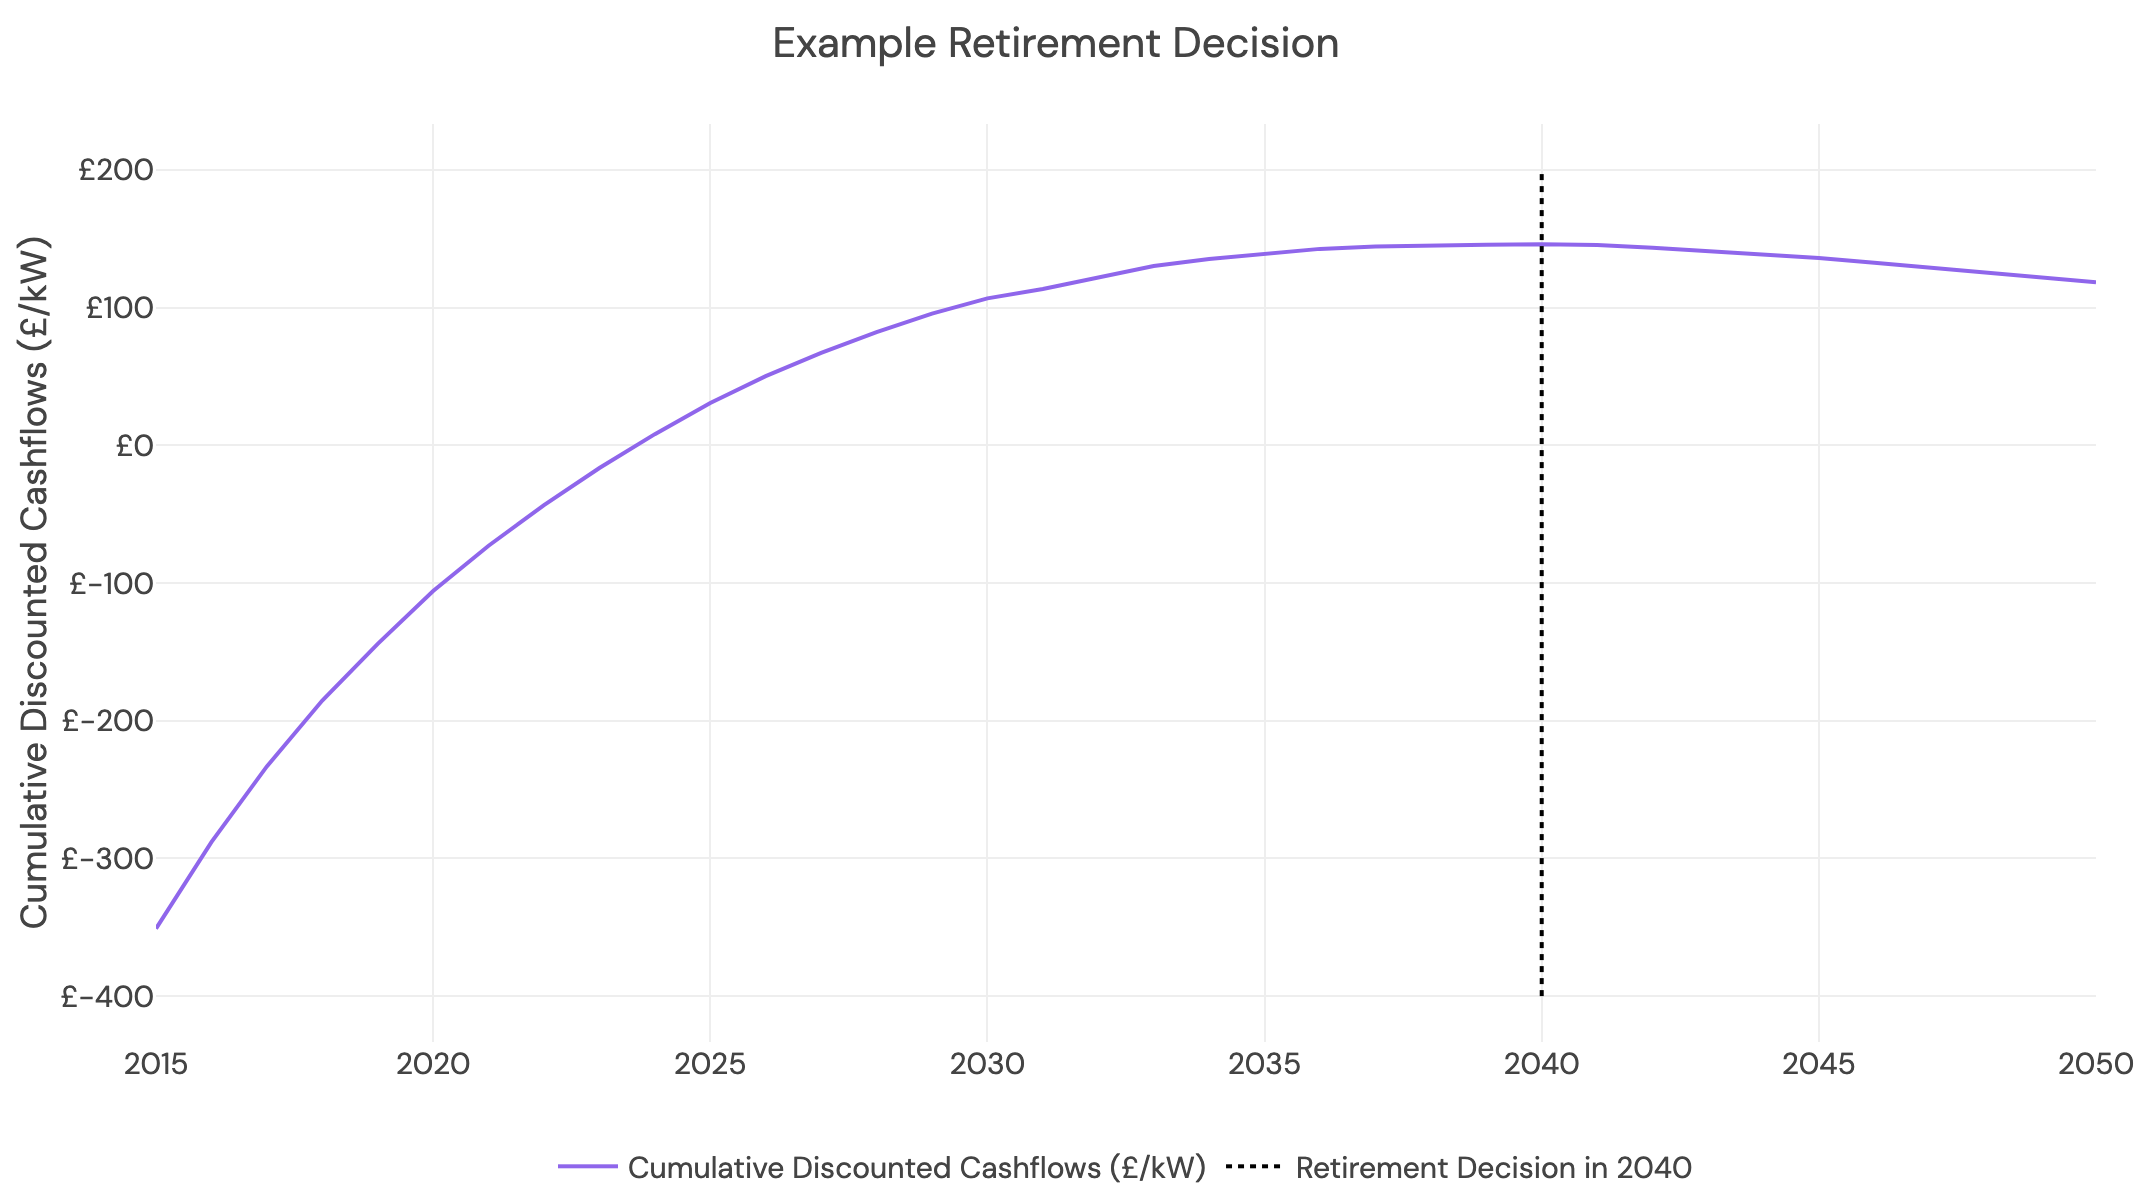
- We make retirement and retrofit decisions for unabated CCGTs. A plant is retrofitted with CCS if this is technically feasible (i.e. close to a planned carbon storage cluster), profitable (NPV is greater than 0), and preferable to continued unabated generation (i.e. there is a higher NPV for retrofit). CCGTs that are not retrofitted with CCS are retired in the year of their maximum cumulative cashflows.
- We make new build decisions for abated CCGTs. New abated CCGT plants are built when IRR exceeds the hurdle rate. We allow a maximum of 3 abated CCGT build decisions in each model iteration (ie across the forecast horizon). We assume that newly built unabated CCGT plants have a capacity of 0.9 GW.
- We make new build decisions for gas reciprocating engines. New plants are built when IRR exceeds the hurdle rate. New-build gas reciprocating engines have capacities of 100MW, and we allow a maximum of 10 new-build decisions for each in each iteration. Existing OCGTs and gas reciprocating engines are retired in the year of their maximum cumulative cashflows. We don't build any new OCGTs.
- We make new build decisions for batteries. New batteries are built when IRR exceeds the hurdle rate. We allow a maximum of 10 new-build decisions over the time horizon per iteration, and a maximum of 3 GW of batteries to be built each year. We assume that newly built batteries have a capacity of 0.2 GW.
For example, when we say we allow 10 new build decisions for storage in each model iteration, it means we could build 10 new batteries in iteration 1, i.e., 1 per year from 2030 to 2040. In iteration 2, we build another 10 - giving 2 per year from 2030 - 2040. This could push spreads down in the price model - reducing IRR - so in iteration 3 we get 1 per year from 2030 - 2037, ie 7 new systems. Or, 17 new systems in total.
As we loop through multiple iterations of the model, it converges on a suitable build-out: one that responds to system needs without saturating the revenues (causing low IRRs) and avoids an overbuild.
The evolution of battery storage capacity across iterations of the capacity expansion model
All decisions are reversible. This means that any under or overbuild of a generation type can be corrected in the next iteration. This results in an iterative process where capacity build-out converges to an optimal solution.
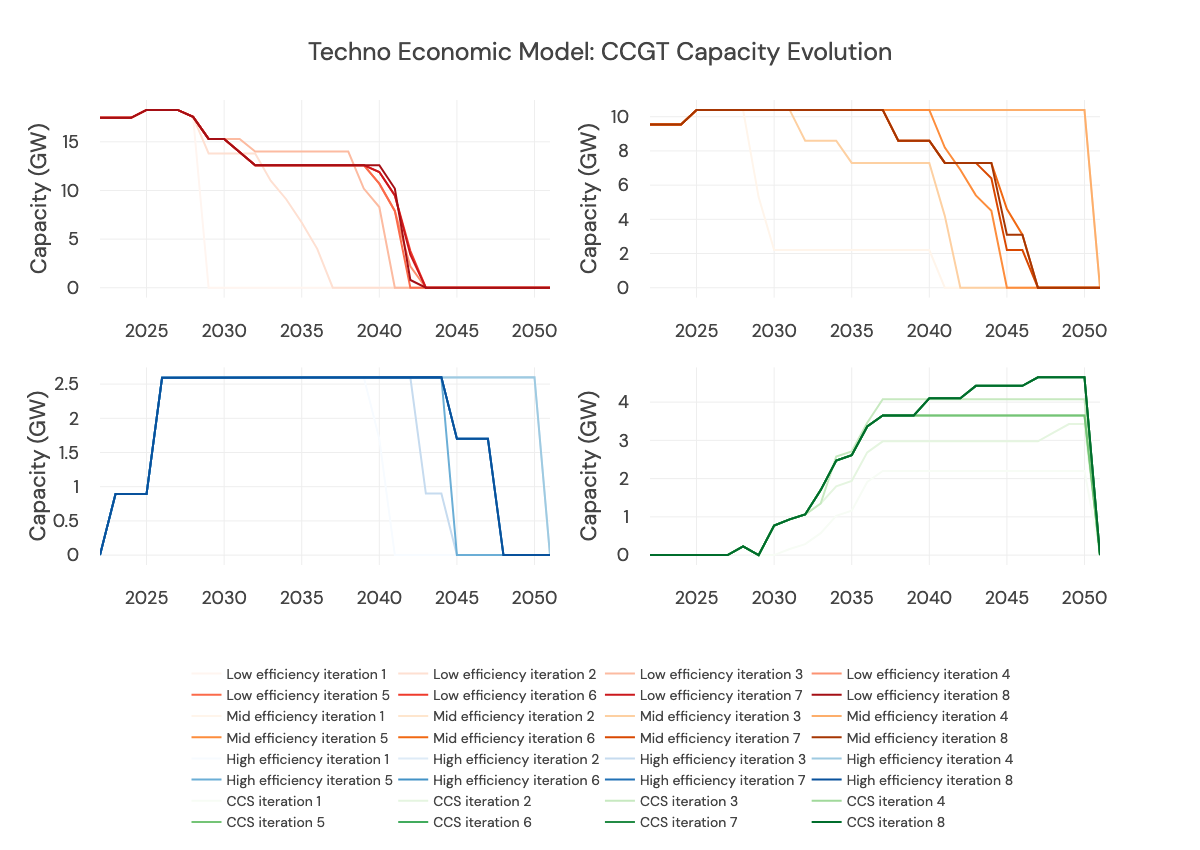
An example of varying technology build-out. This is taken from a development run and is not used within the final forecast.
Updated 2 months ago