⍅Backtest
How does the model compare to reality, when we look at historic day ahead prices?
We run the model over 2021 & 2022 and compare our half-hourly price to N2EX day ahead hourly prices. We replace some of the inputs to the model with historic data to get an assessment of 'the model' (as opposed to the inputs).
Backtesting fundamentals model: price
We compare a data point every half hour (our forecast) to a data point every hour (the N2EX day ahead price). We take that hourly data point for and make two per hour so we can compare every forecasted data point.
Using historical data for some of the inputs
We normalize the model as much as possible - so give it real historic data and see what the model generates. This allows us to compare our model to historic data and hope to achieve something vaguely close.
- Using daily SAP gas price (this means the shapes track)
- Actual wind data
- Plant availability (via MEL data) for CCGTs and OCGTs
- We use our forecast demand (rather than historic demand)
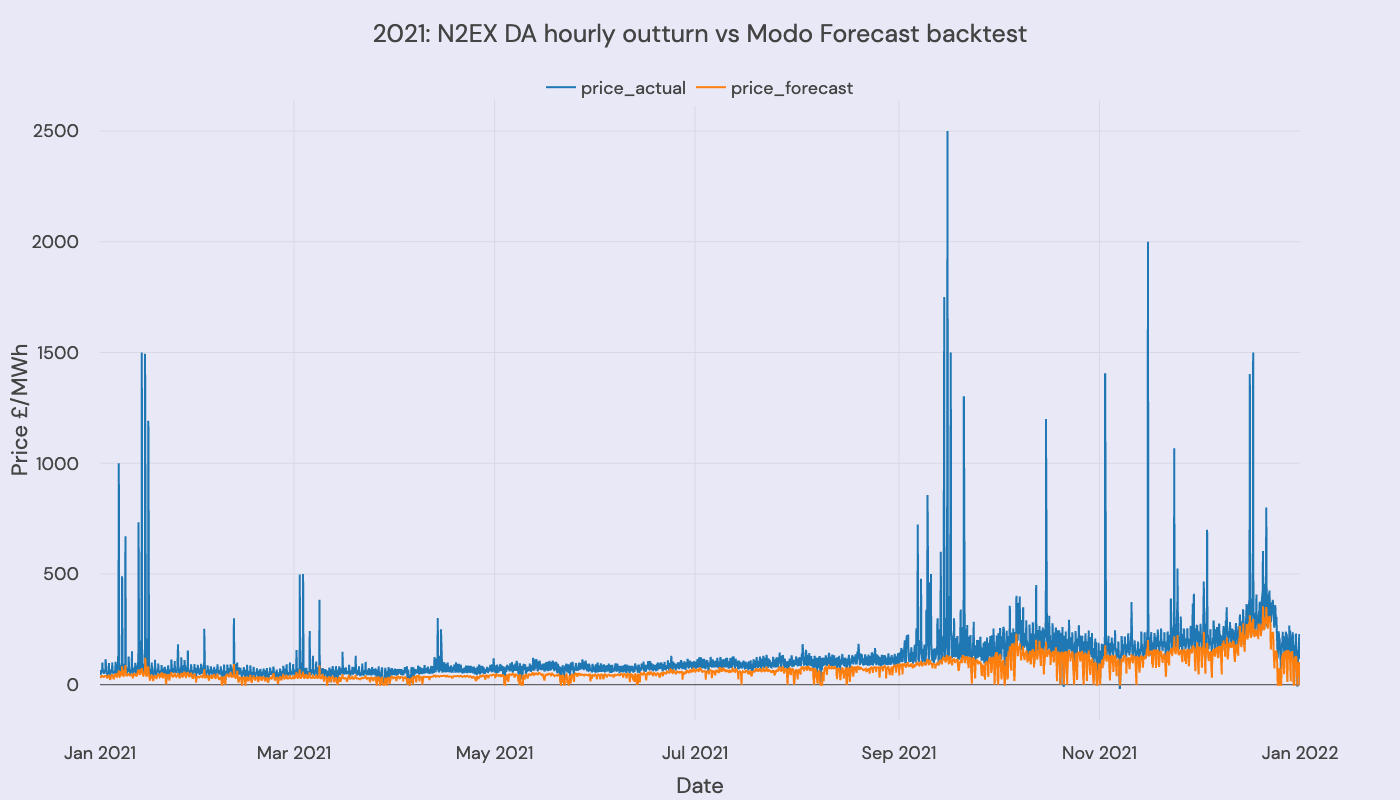
For 2021:
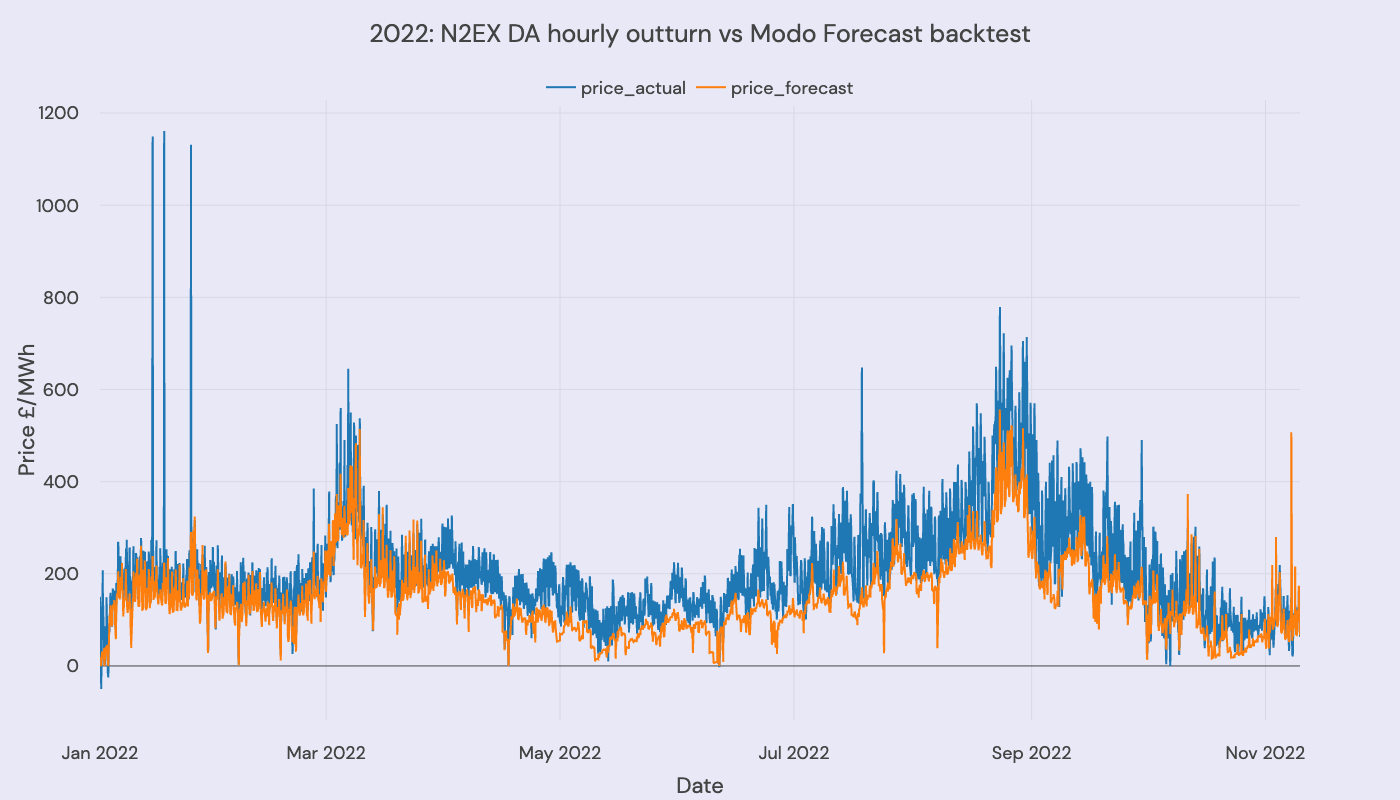
For 2022:
Highlights (or lowlights) on the fundamentals model
- We underpredict absolute prices by around £50/MWh and intraday spreads by a similar amount.
- Both 2021 and 2022 saw far more intraday volatility than our model predicts. There are a few reasons for this:
- The Russian invasion of Ukraine - and linked record high gas prices - added a significant risk premium to market operators.
- The gas and electricity markets were in contango (future markets were worth more than spot markets) - and peak power especially was over-valued.
- In periods of tightness, particularly over £500/MWh, a scarcity premium emerges in power markets.
- Considering these factors, a huge risk premium was priced into the market: this is not captured in our fundamentals model.
- We don't model CCGT ramp rates in our fundamentals model. This also explains some of the shortfalls in the intraday price volatility.
- In 2023, things have calmed significantly, and the markets for energy storage have shifted. So, we backcast the whole revenue stack for batteries in 2023 (and do much better!)
Backtesting battery revenues for the first six months of 2023
For battery energy storage, 2023 looks very different to 2021 and 2022, and our backtest of battery revenues does much better with respect to the Modo Benchmark.
This is for several reasons:
- The gas markets have calmed (or 'crashed') following the impacts of the Russian invasion of Ukraine in 2022. Wholesale intraday spreads have returned to something resembling 'normality' - i.e. few intraday spreads are currently around the £50/MWh range.
- The Dynamic Frequency Response markets are now 'fully' saturated. There are more batteries than ancillary services requirements, which means they follow more 'economic' behaviors (not a £17/MWh price cap). This brings performance closer to a fundamentals model.
- Modo has been warning about saturation for some time. We've seen the lowest Modo benchmark revenues since early 2020 and significantly lower than the highs of Summer 2022 (when the markets were not saturated).
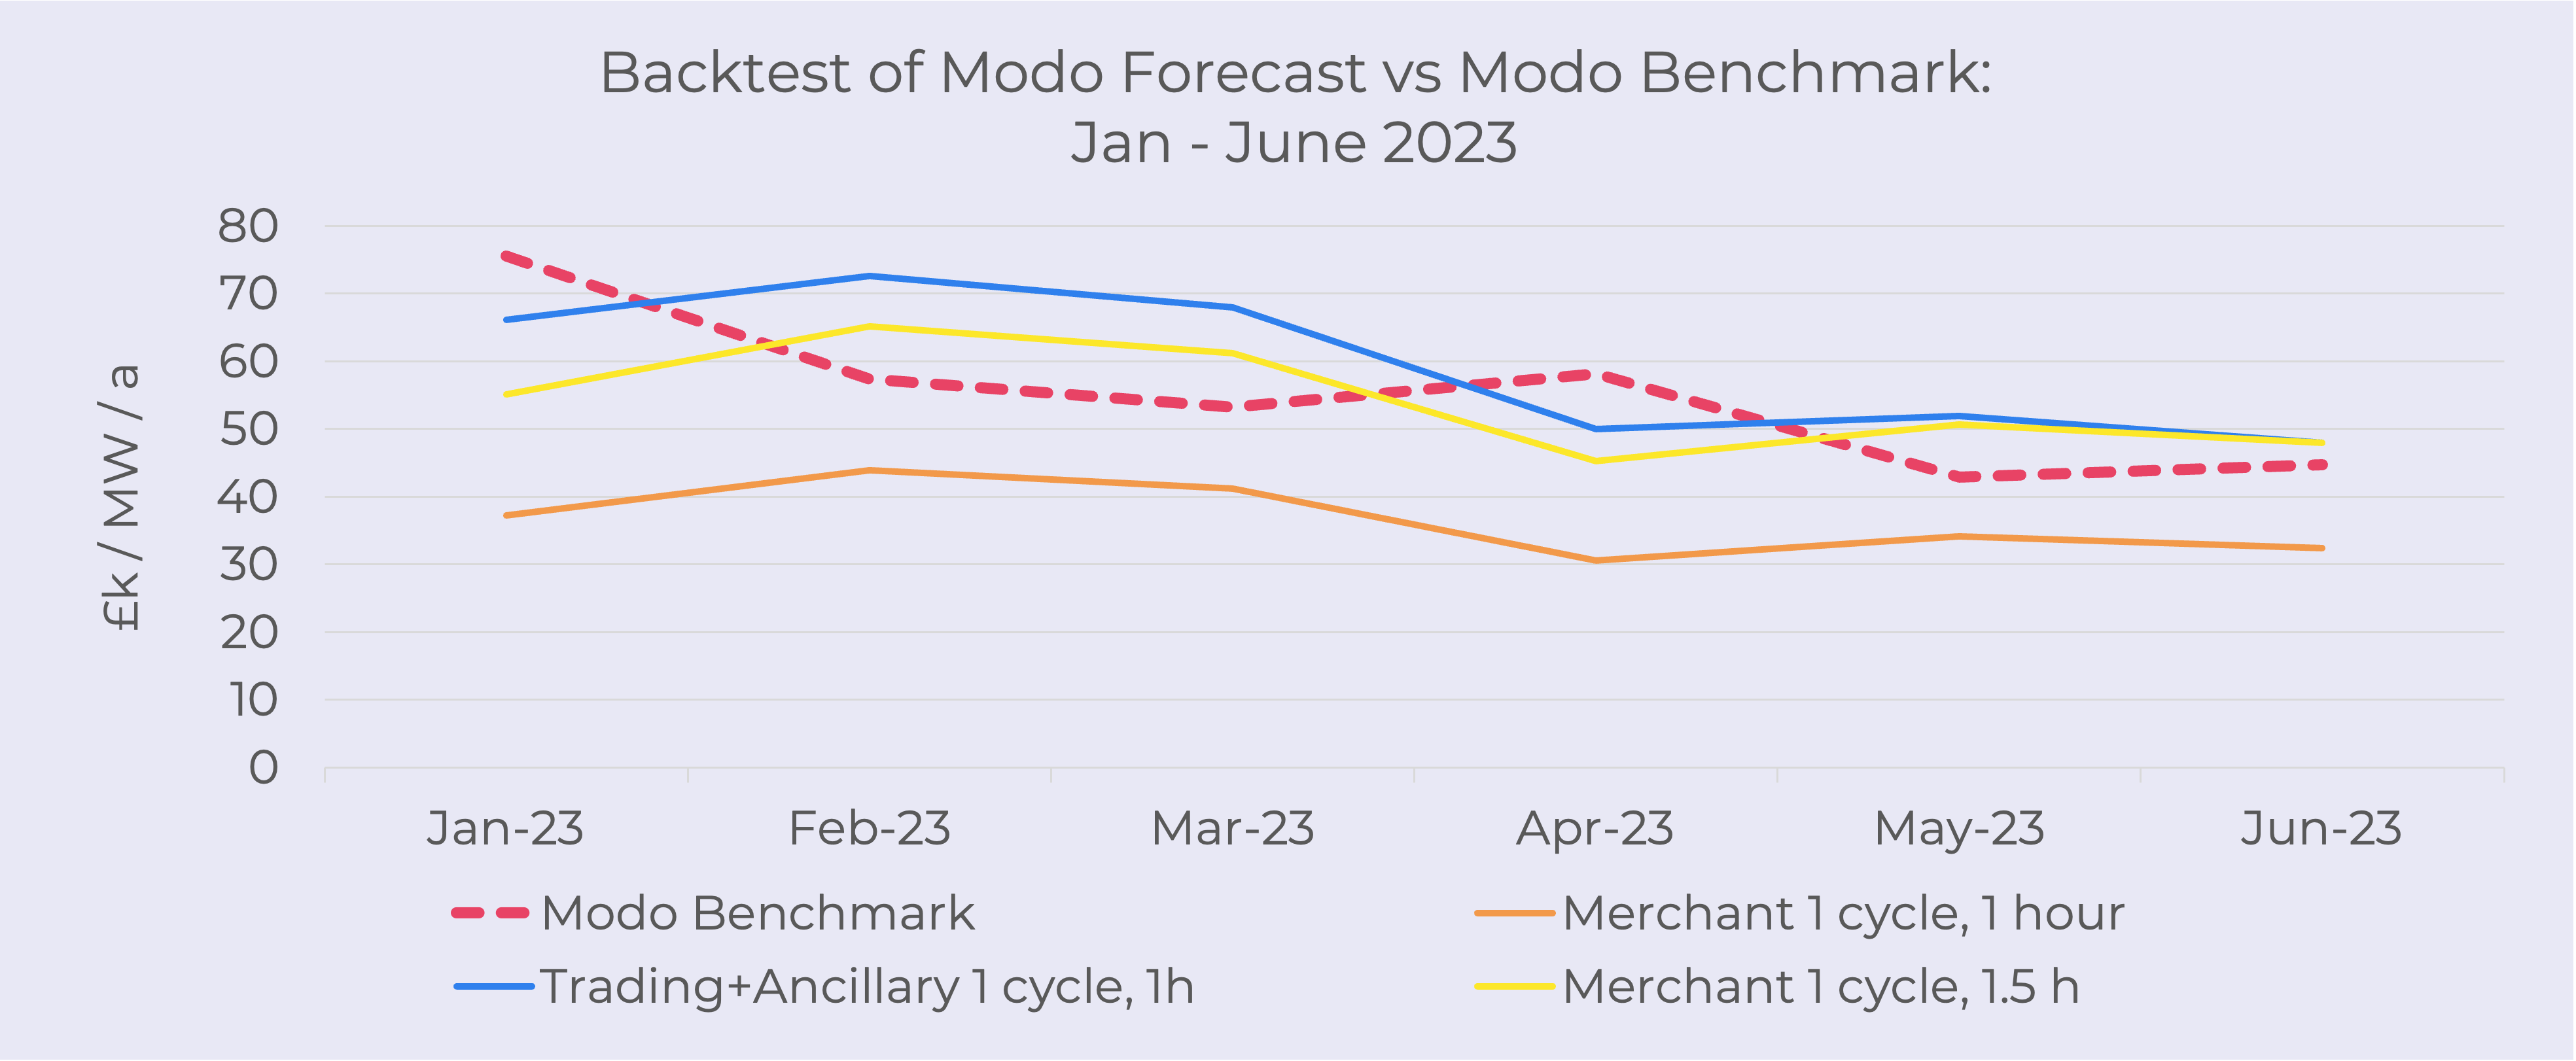
So, we compare the Modo Forecast 'as is' (i.e., in our central case) for the first six months of 2023, vs. the Modo benchmark across the same period.
The Modo benchmark represents the average £/MW the fleet has actually earned.
We track all assets above 7MW in size, and report on those we have enough data on to be confident in their reported revenues. More detail on how we produce the benchmark (and leaderboard) is in our help center.
The fleet duration is now c.1.2 hours and c.1-1.5 cycles per day - with variation around this.
Updated 5 months ago