Frequently Asked Questions
How are you backcasting results?
See our backcasting page (in progress).
How often do you update the model?
We update the model quarterly.
How do you deal with price cannibalization for renewable assets?
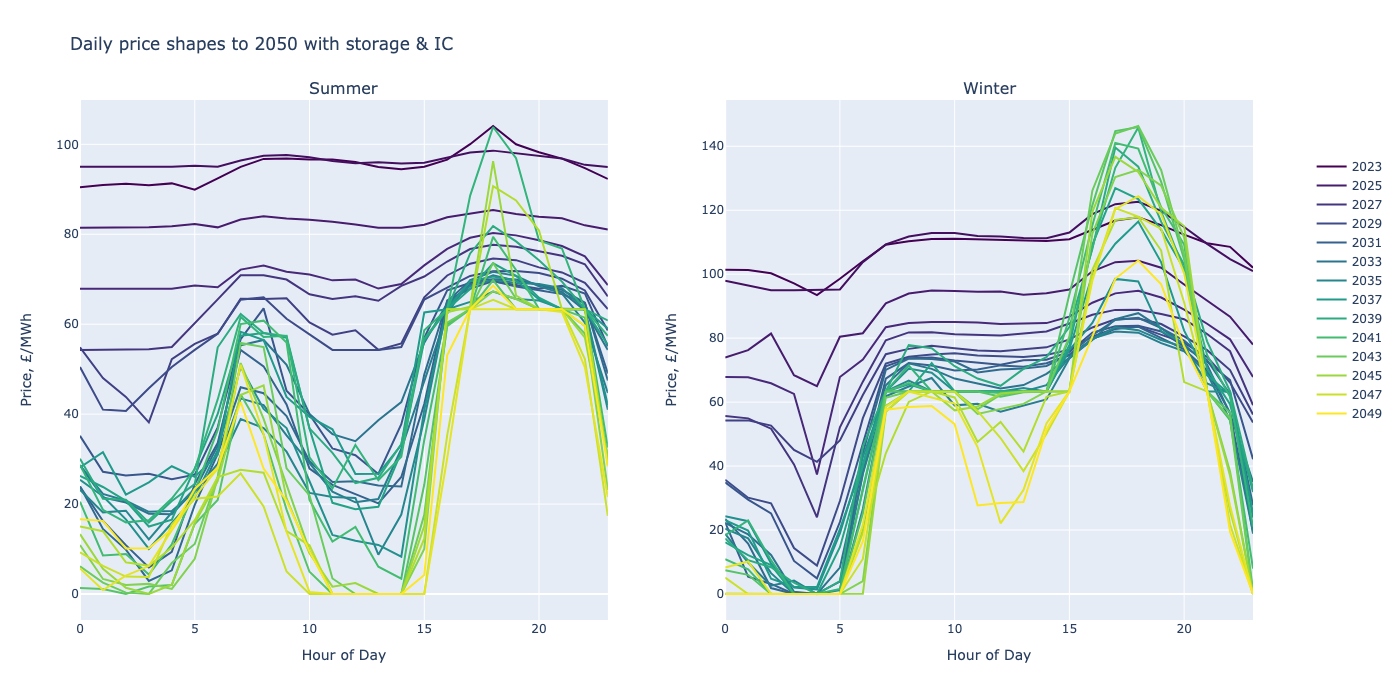
In a world with many GW of renewable generators on the network, when the sun shines, or the wind blows, the price of electricity crashes as a huge amount of (cheap, or free) solar and wind power floods onto the system simultaneously. This means the 'capture rate' for renewable assets - the average power price they achieve vs the overall average power price - is less than 100%. We see it today - it'll get worse over time. Which is an issue for the business model of renewable generators.
In the Forecast, we have a half-hourly model for solar and wind generation and a half-hourly supply stack. See info on our renewable load factors.. So, at times of lots of renewable generation, demand intersects supply when clean, free power is abundant - and the clearing price is £0/MWh (in a post-subsidy regime). An example of this is below.
Generally, we see that the price crashes in the middle of the day due to solar generation (below, left), and similarly, when the wind generation is very high we get prices of £0/MWh.
How do you deal with price cannibalization for storage (and interconnectors)?
Storage charges up when power is cheap, and discharges when it's expensive.
When you have a lot of storage on the system, it might discharge into the same periods, which changes the supply stack. With the addition of storage, there is suddenly a surplus of generation, and as a result, the price crashes. What used to be an expensive period is now a cheap one (and on the charging side, a more expensive one, though to a lesser extent, as charging is typically more spread out).
This means the opportunity for storage is lost - and the storage makes no (or much less) money. In reality, high prices would get damped or suppressed as 'peaks' spread into neighboring periods.
In our storage model, we limit the amount of the storage fleet that can dispatch into an individual half-hour period. More information on this here. This acts to soften the price cannibalization.
How do you model scarcity pricing?
Demand side response (DSR) is priced at £500/MWh, £1000/MWh, and £3000/MWh. It sits near the top of the generation stack, with loss of load pricing at £6,000/MWh above it.
When there is a shortage of generation capacity (usually driven by low wind), a high price results as demand and generation intersect in this high-price region.
What impact do line losses have?
Transmission Loss Multipliers (TLMs) apply to transmission-connected assets.
Energy accounts are settled at the Notional Balancing Point (NBP). Energy is lost due to transmission losses from the point that it is generated to the Notional Balancing Point. For assets at lower voltages (such as those embedded in the distribution networks), the power has to travel through more of the network to get to the NBP - so the losses are higher.
They are regional (there are 14 zones corresponding to each Distribution Network or GSP group) and time-of-use dependent. There are two types of losses: Transmission Loss Multipliers (TLMs) and distribution level losses (D-loss). Typical values for these:
- TLMs ~ 1%
- D-Losses ~2%
They also depend on the voltage level of the asset in question. Usually, multipliers are higher overnight than during the peaks. They can be negative as well as positive. The TLM calculation attributes part of the transmission losses to generation and part to demand: there is a Generation/Demand split (currently, 45%).
Further explanation and example calculation for TLMs is given here.
What do TLMs mean for storage?
Transmission-connected assets will be subject to TLMs only and not D-Losses.
Most batteries connected at the distribution level will be connected at EHV - and the D-Losses will be minor (less than the 2% quoted above).
Below is an example calculation of TLMs for a charge and discharge action in the summer in Nothern Scotland. We import 100MWh/88% (to account for battery efficiency) at 4am when the energy rate is £10/MWh. We export 100MW at 5 pm at a rate of £100/MWh.
TLM example | Energy Price £/MWh | Metered Volume | G/D split | TLF (zone 14, Summer) | Average Transmission Loss |
|---|---|---|---|---|---|
Charge (demand) | 10 | -100MWh / 0.88 = -113.6MWh | (100-45)% | -0.01471 | 2% |
Discharge (generation) | 100 | 100MWh | 45% | -0.01471 | 2% |
These example prices are lifted from the National Grid ESO TLM guidancedocument
Example of energy generation revenue at NBP
= Energy Tariff x (Metered Volume x TLM)
= Energy Tariff x Metered Volume x (1 +TLF + Gen Loss Adjustment)
= 100 x 100 x [1 + (-0.01471) + (–1 x 2% x 45%)]
= 100 x 100 x 0.97629
= £9,762.90
Example of energy demand cost at NBP
= Energy Tariff x (Metered Volume x TLM)
= Energy Tariff x Metered Volume x (1 +TLF + Demand Loss Adjustment)
= 10 x 113.6 x [1 + (-0.01471) + 1 x 2% x (1-45%)]
= 10 x 113.6 x 1.02571
= £1165.20
The Modo Forecast we don't take into account Transmission Loss Multipliers.
Users should apply the relevant loss multiplier to their site to account for them.
TNUoS charges are calculated using metered volumes, not loss-adjusted volumes.
Using the above example, instead of
£100/MWh x 100MWh - £10/MWh x 113.6MWh = £8864 profit
We have
£9762.90 - £1165.20 = £8597.70 profit
I.e. a difference of around 3% uplift.
How do you deal with negative pricing and CfD payments?
Depending on the year the CfD has been awarded, payments stop after a certain number of consecutive hours of negative pricing.
Our CfD fleet is split into the early auctions (AR1) and later auctions. The AR1 fleet is priced at -£100/MWh - effectively, it never turns off. The later auctions are priced at £0/MWh.
You might expect, after many hours of negative pricing (above the cap of the auction round), assets turn off as they'd have to pay to generate.
We don't consider the previous half-hour's price when dispatching the subsequent half-hour. This means this is not dealt with in our model. We may therefore have more negative pricing than you might expect - as if these assets were to turn off, there would be less generation on the system (and the price would return to £0 or above).
However, there is uncertainty around how you'd turn off GW of wind or solar with a few hours notice and no major operational cost.
Is there a volume limit to the BM? If so, how do you set that?
The BM is essentially bottomless, we don't set a volume limit. But applying a dispatch rate (see our Balancing Mechanism revenues page) helps to keep that figure sensible.
Why are there more price spikes in 2049?
This is mostly driven by a decrease in gas CCGT generation. See our capacity stack page [here]. This reduces generation capacity in the supply stack, particularly on low wind days.
This means that generation and demand more frequently intersect in the high-price region at the top of the supply stack, with prices set by DSR and loss of load.
Updated 5 months ago