
FAQ: Results
- Are your revenues using real or nominal prices? Are the revenue outputs themselves real or nominal?
- Why does annual demand TWh not match total generation TWh in the scenario databook?
Are the BESS revenue forecast values real or nominal?
In the model, we use Real prices from the base year 2023 only. This aligns with the values used by the FES. Therefore, the BESS revenue values have not been adjusted to reflect the latest inflation rates.
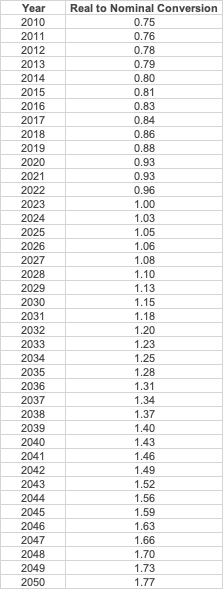
If you need Nominal revenues, the FES suggest the following table for conversion from real to Nominal prices.
If the FES values are updated to Real 2024 prices, we will do the same.
Real vs nominal values:
- Real values are not inflated. They are adjusted to remove the effects of inflation. This means that when calculating real values, the goal is to isolate the true economic or quantity changes by holding prices constant at a base year level.
- Nominal prices are inflated. Nominal values reflect current prices at the time the money is received or spent, and they include the effects of inflation (or deflation).
What do the results look like?
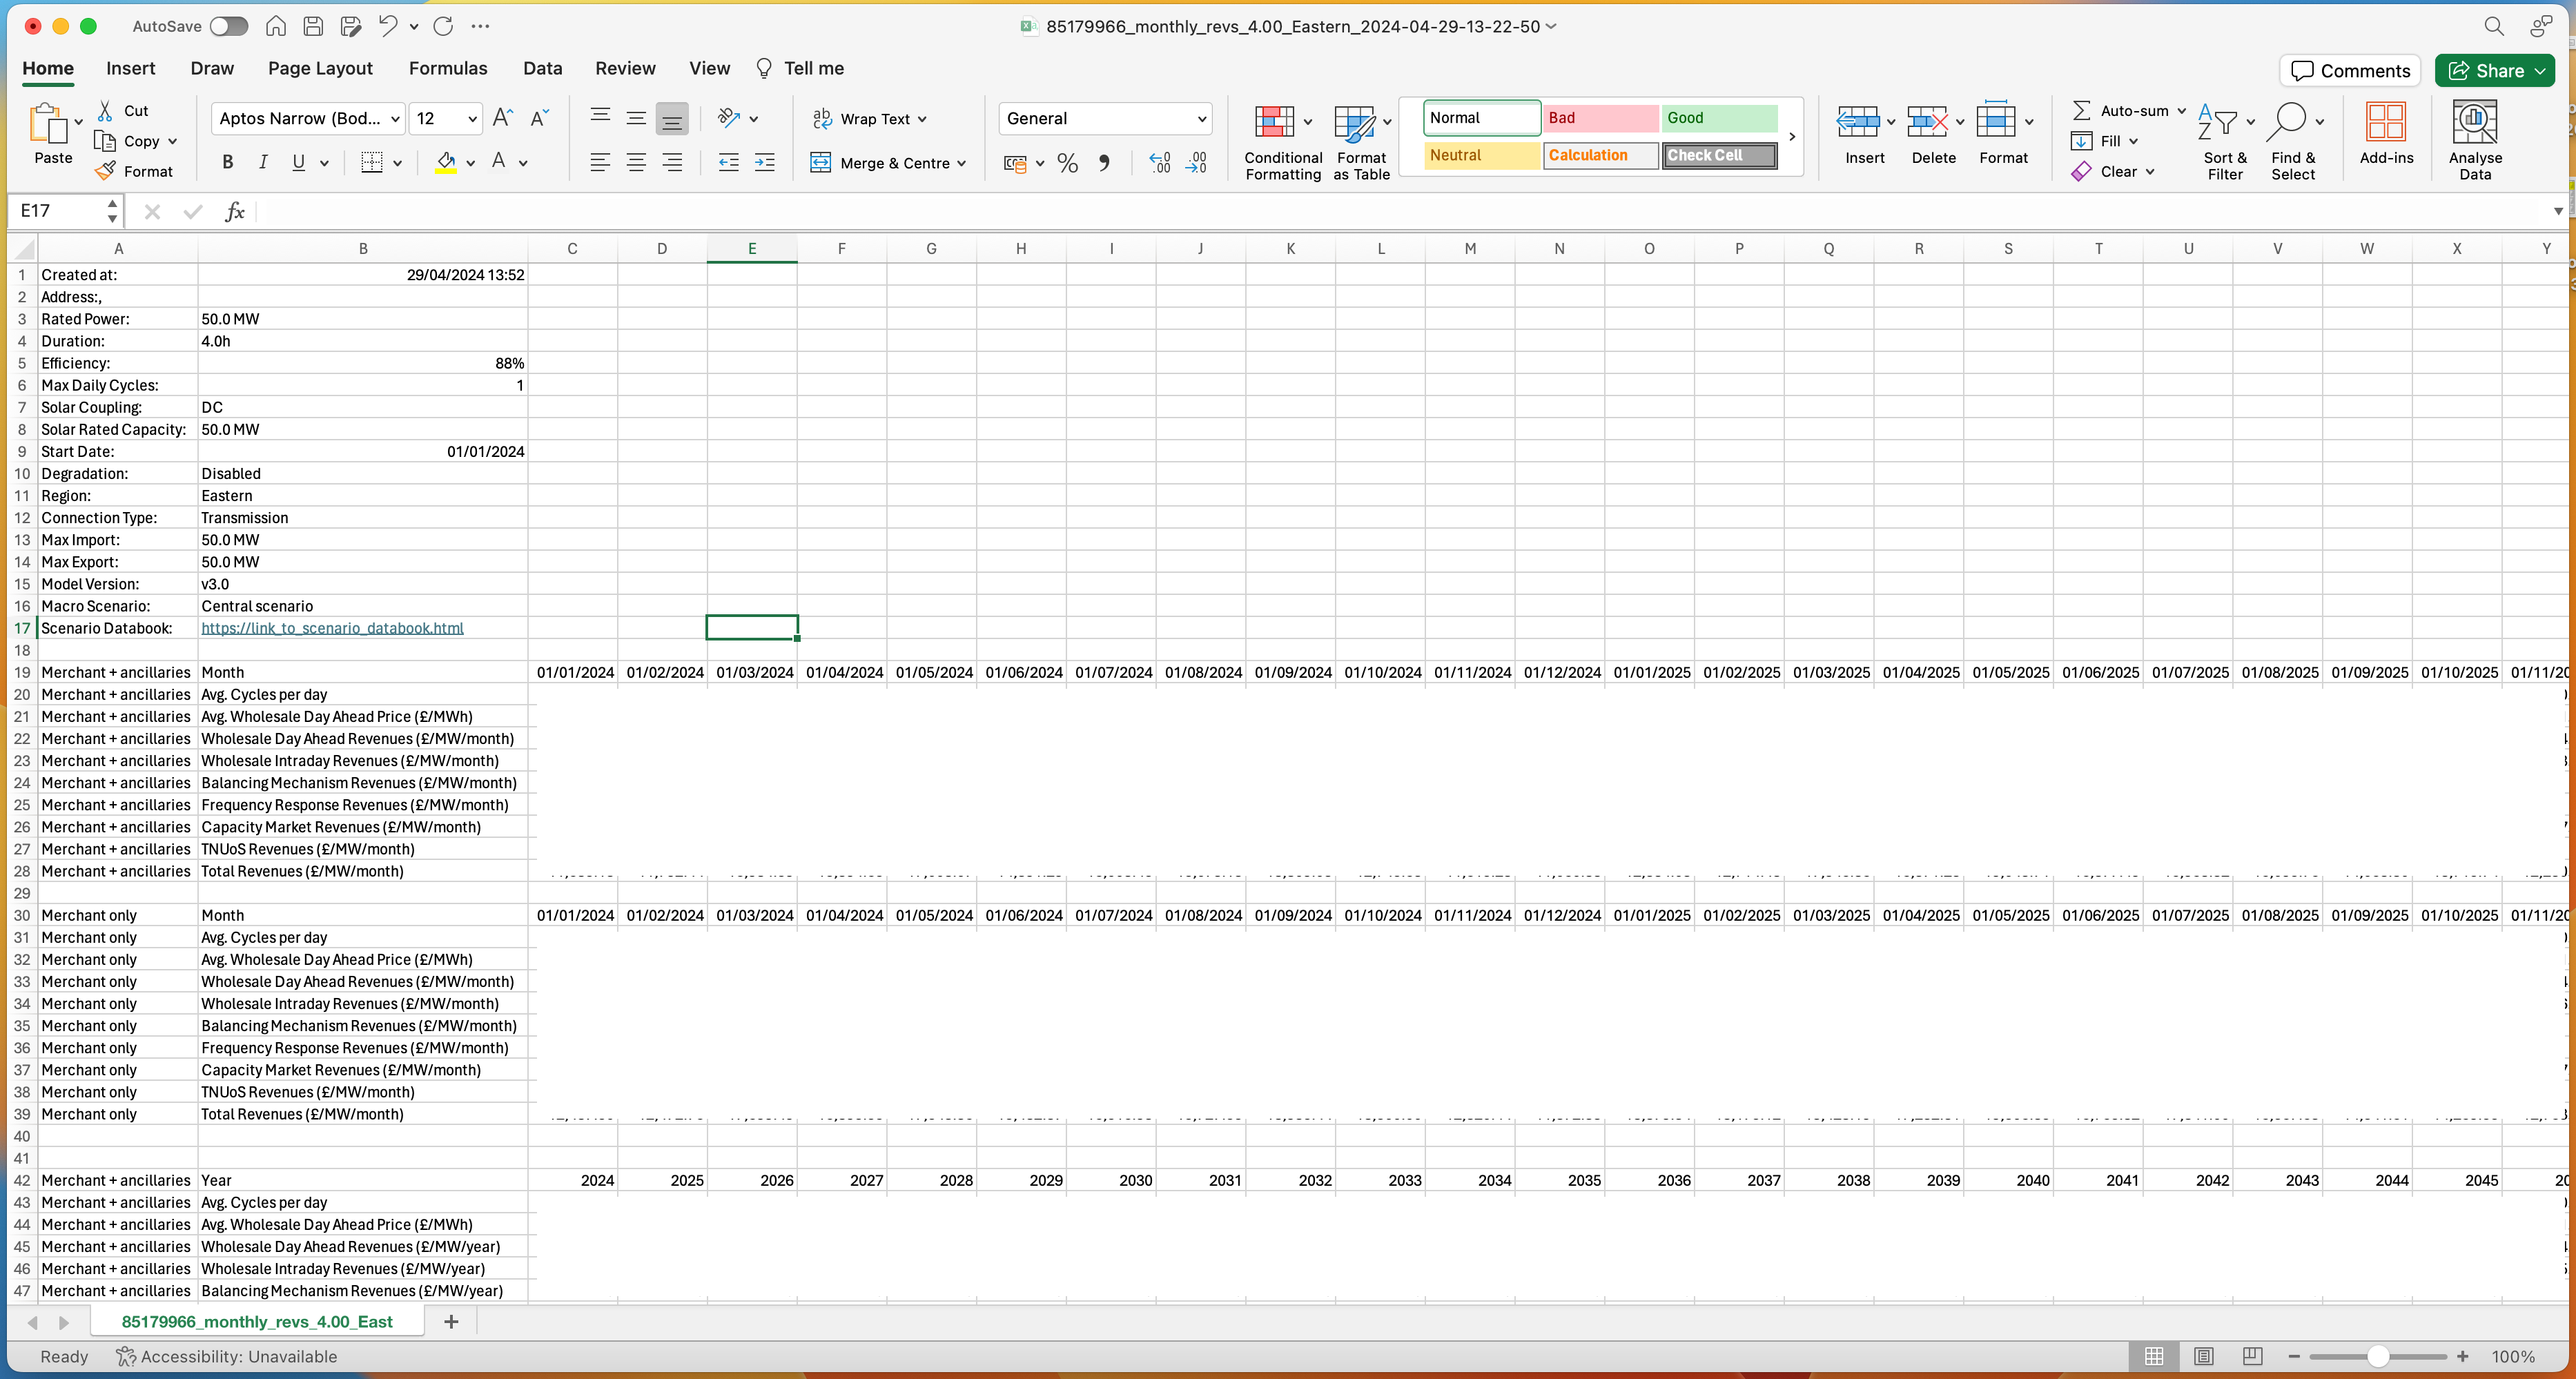
When you download a run from the platform, you get a csv file which has details of the run - ie site setup, location, connection type, model version number. It also contains a link to the scenario databook, where you can find some of the inputs to the model.
Below this are monthly revenues for "Merchant and ancillary revenues" and "Merchant-only" revenues. These are broken down by different revenue streams and show cycling numbers.
Below is the same thing but aggregated annually.
The format of the revenue numbers is wide:
What do the results show?
"Merchant and ancillary revenues" represent a cross-optimization between day ahead and dynamic frequency response services for a specified battery in the specified location. "Merchant only" is a pure day-ahead wholesale price optimization, so the frequency response revenues are 0. esale power price.
Both have an uplift due to the balancing mechanism, intraday and capacity market, and TNUoS revenues, but these differ due to the different availability left over after the day-ahead optimization. Each of these is shown separately.
We also show the average cycling per day and the average predicted wholesale power price.
Why does annual demand TWh not match total generation TWh in the scenario databook?
The demand we show is domestic only, so excluding any demand from interconnectors, energy storage, and curtailment of renewables.
In 2050 we have 55GW of energy storage (battery, pumped, and other) and 22GW of interconnection. These represent a significant demand - energy is lost in charging each of the storage types due to efficiencies, and interconnectors represent a demand when we export power to the continent.
Updated 8 months ago