
v3.2 release: changes since v3.1
8th October 2024
The changes this quarter are mostly within the fundamentals model. Check out the changes to demand, wind buildout, and gas price - to name but a few.
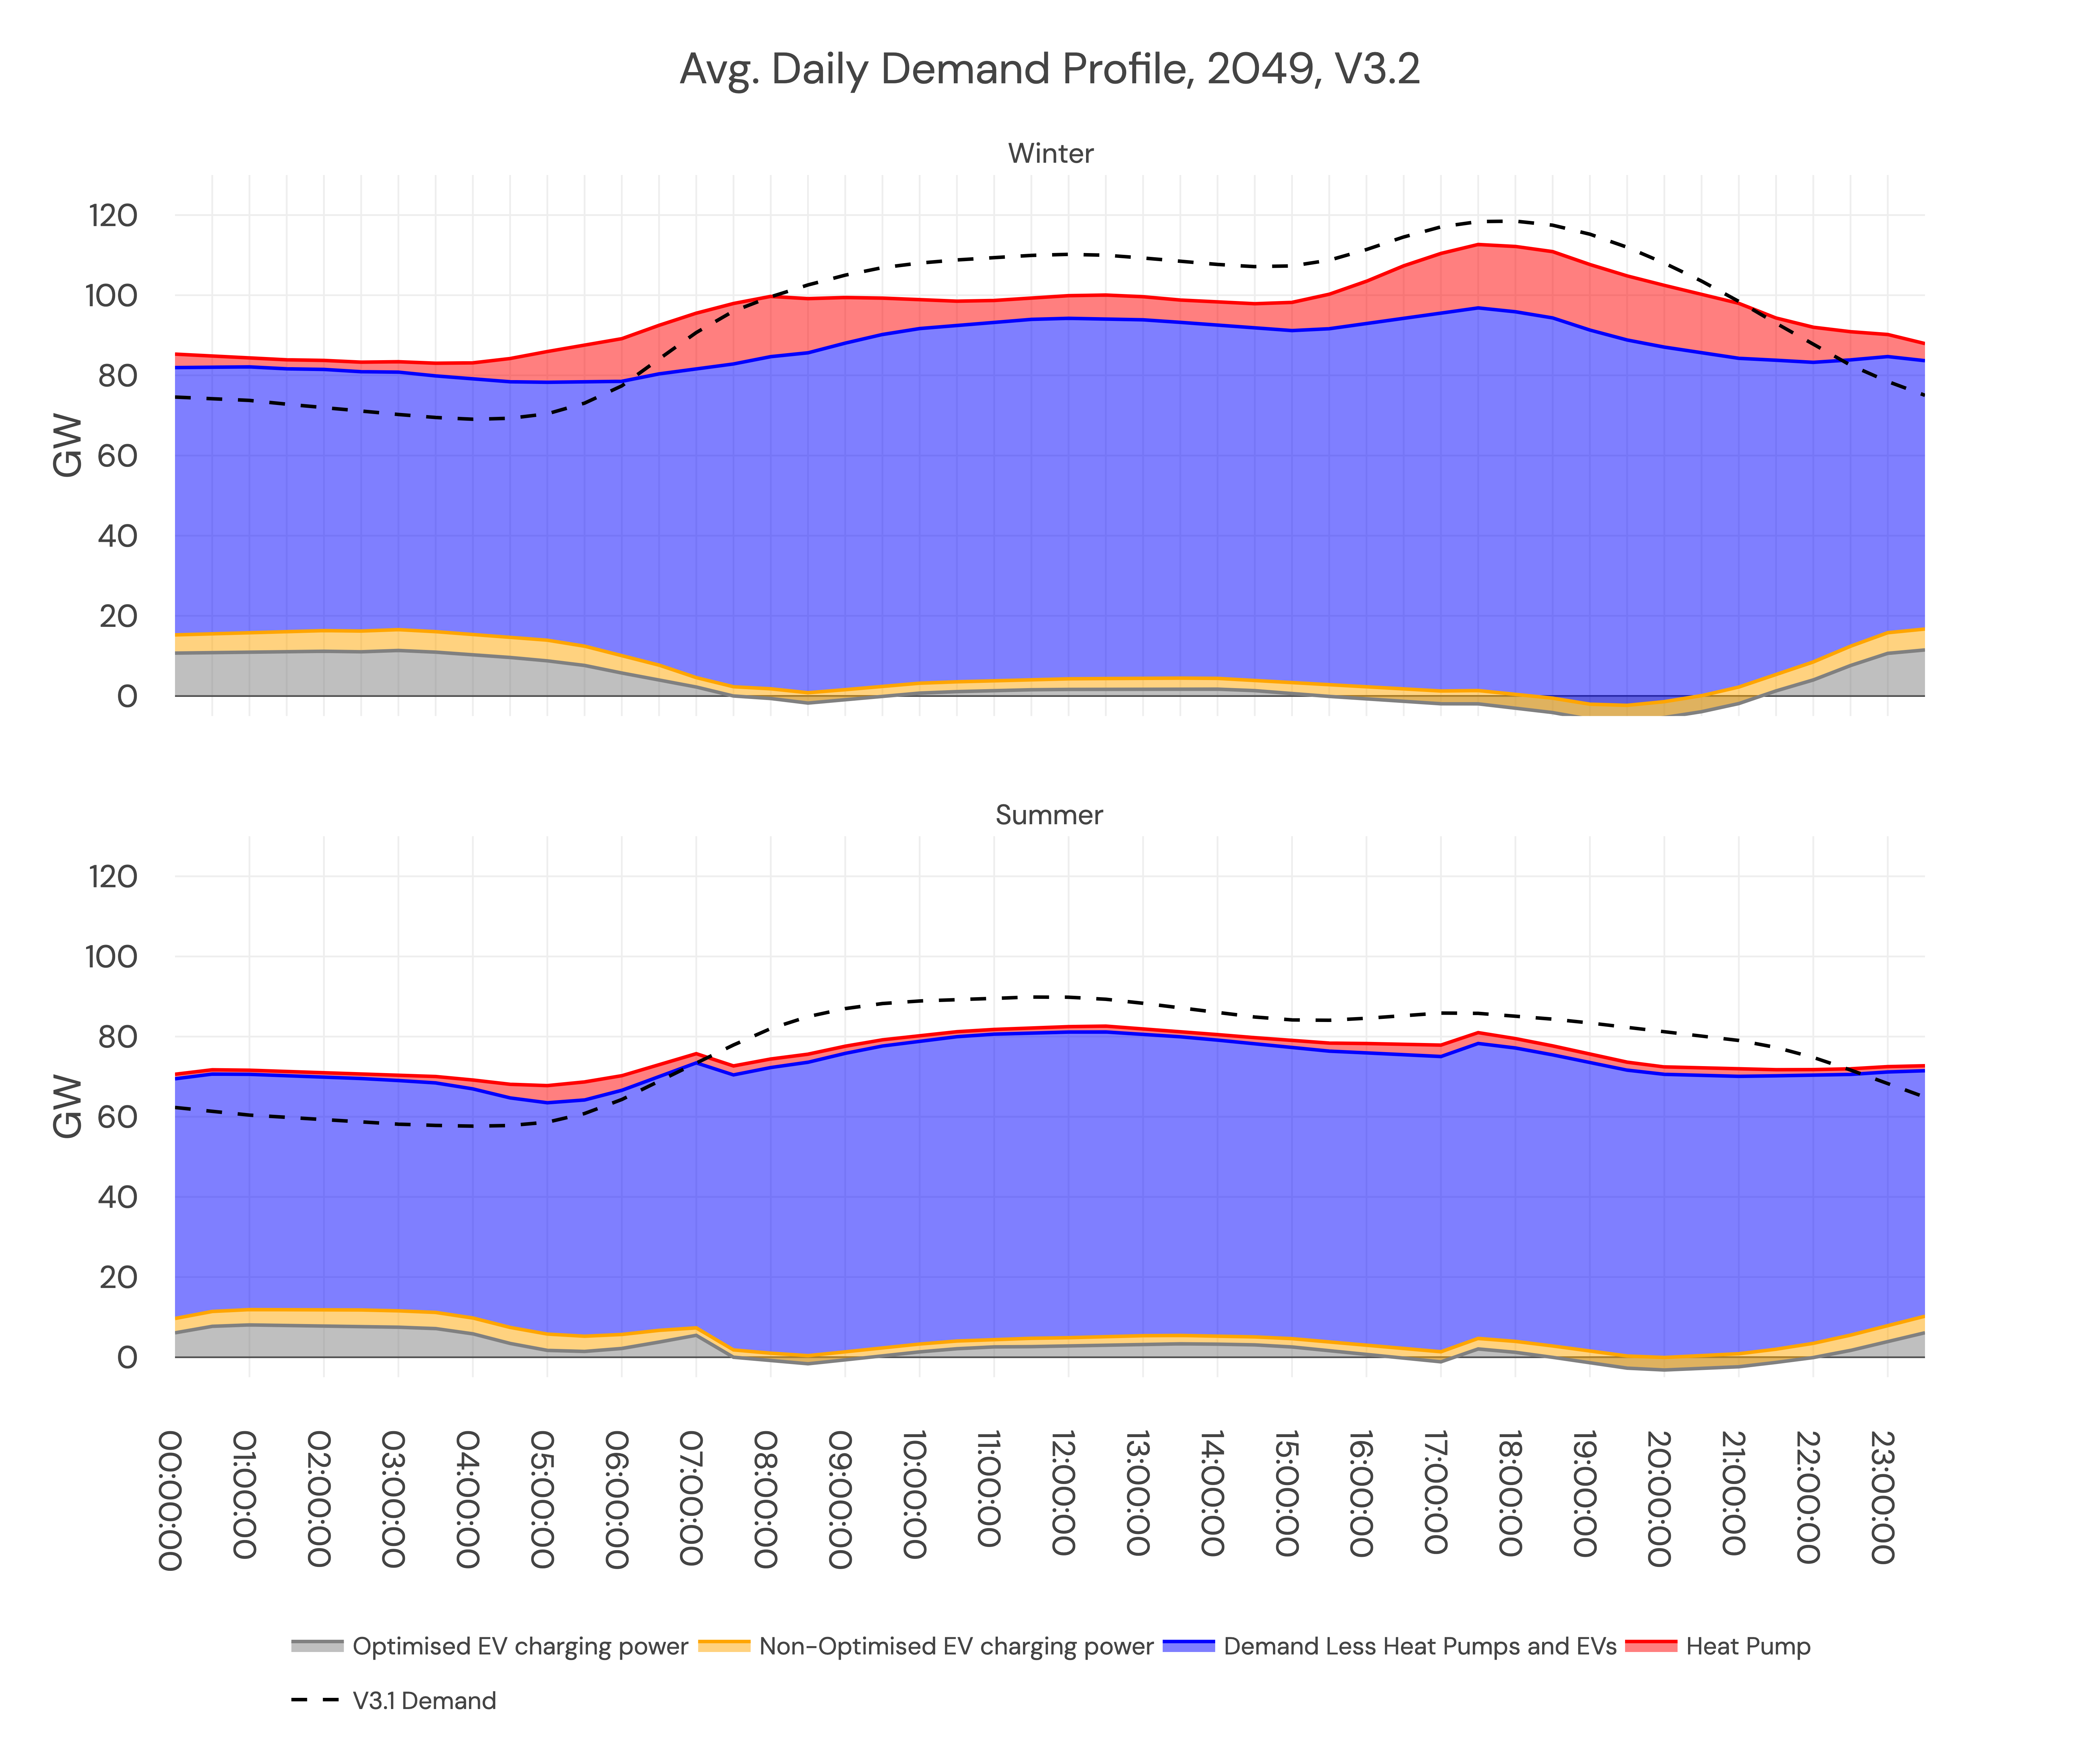
1. Specific EV & heat pump models change demand shape, making it more price-sensitive
We forecast to have 30 million Electric Vehicles (EVs) on the road by 2050. We will also see many GW of heat pumps on the system, as Great Britain electrifies heat and transport.
We now isolate EVs and heat pumps and forecast their demand independently. We expect some EVs to be price sensitive (via smart charging, with a smaller capacity of Vehicle-to-Grid) and, therefore, compete with battery storage. Heat pumps will be less flexible but have a demand pattern that (in winter) peaks both in the morning and the evening as homes switch on their heating. By 2050, we expect large winter evening peaks driven by 8GW of demand from electric domestic heating.
We now capture the individual shapes of these within our demand forecast - and how they contribute to nationwide demand and, therefore, the effect on wholesale power prices.
The impact is that demand is generally flatter, but more seasonal. There is higher demand overnight driven by smart charging and lower demand at peak (compared to v3.1). This leads to higher wholesale prices overnight, which pushes daily spreads down. As heat pump demand picks up in the 2040s, winter evening peaks grow—and our demand peaks at over 110GW. This is 5GW less than in v3.1!
2. Updates to commodity prices
We update gas prices with the latest forward curves from CME for gas prices to 2029, and the latest 2024 Future Energy Scenarios for prices further along the curve. We also blend the forward curve with the long-term forecast of gas prices, which smooths a jump we previously had in the gas price in 2029.
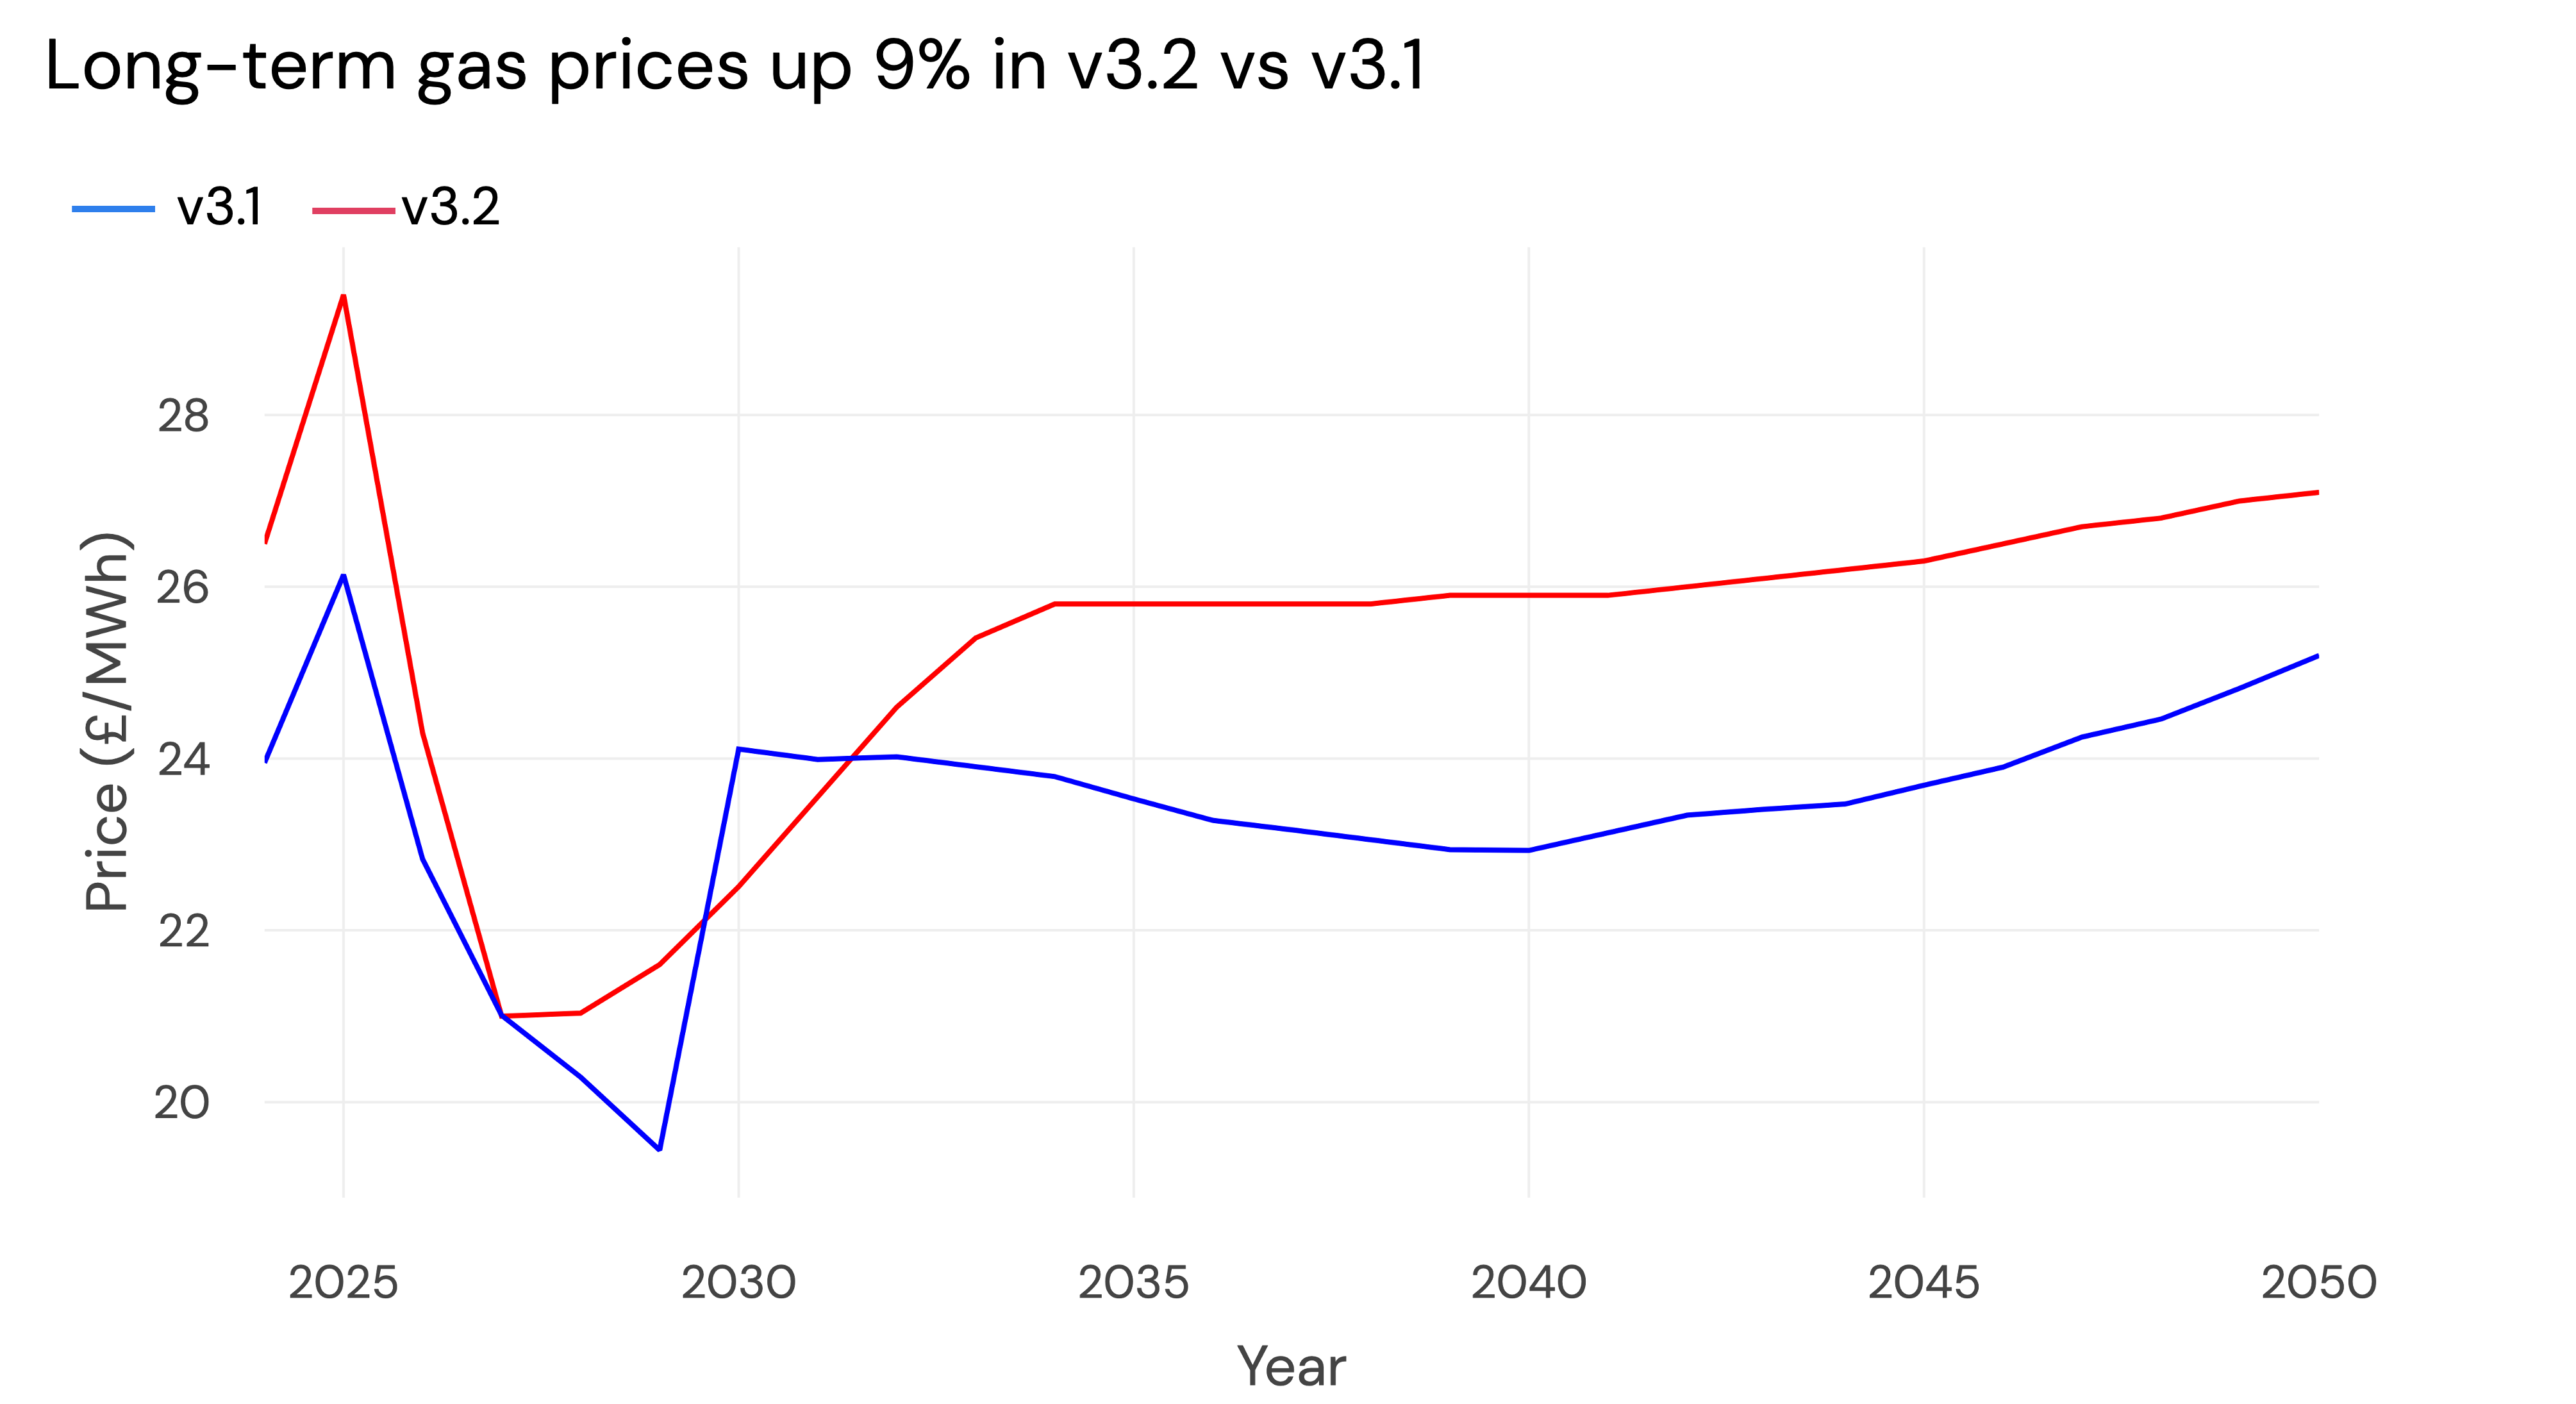
Long term, gas prices are up 9% from the v3.1 release, and this has pushed up wholesale prices in the short term.
Carbon prices from UK ETS futures (ICE) are also updated; they have increased by 3% to 2027.
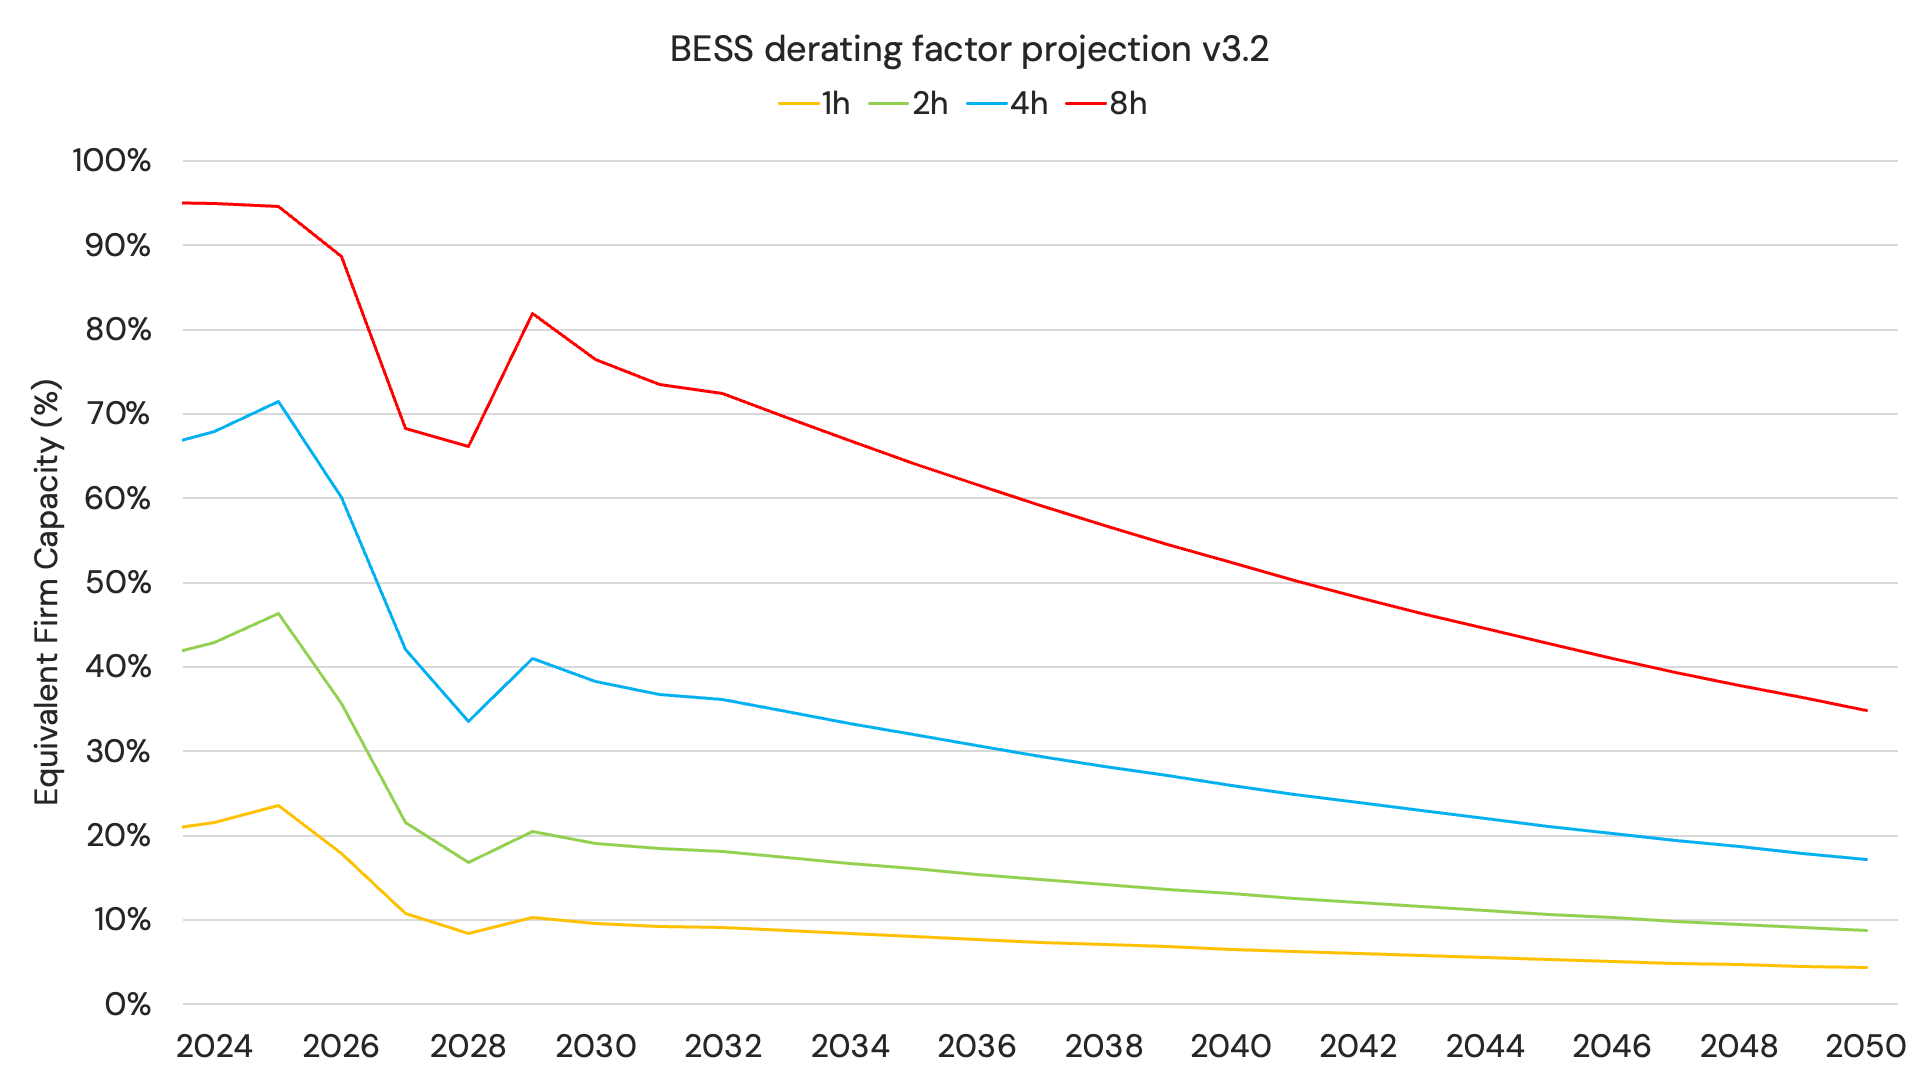
3. Updates to Capacity Market de-rating factors
Previous updates to Capacity Market de-rating factors (which take effect in 2026) and more recent changes to Capacity Market derating factors of Equivalent Firm Capacity for storage are also included. After 2028, NESO's new derating factor methodology for BESS will apply, boosting 1-hour systems from 8.4% in 2028 to 10.3% in 2029. We have revised our projections of these to 2050.
The impact is that in 2026, we see an increase in Capacity Market revenues for storage, as the de-rating factors increase before they fall again in 2027. In 2029, CM revenues jump again with the new methodology. After this, they again fall away in line with the expectation that energy-limited assets of a certain duration become less valuable to the system as loss of load events become longer.
Read more here.
4. Wind buildout adjusted for AR6 results and reduced long-term projection of offshore wind
Both onshore and offshore wind buildouts have been updated to reflect the latest AR6 results in the latest Contracts for Difference round. Our solar projections were already in line with the AR6 results so they are unchanged.
The pipeline of offshore wind sites has been updated with the latest commissioning dates of known projects, including staged commisionning for particularly large sites. Many of these dates have been delayed by a year or more compared to our previous projection. We assume the Scotwind projects will come online between 2035 and 2040, with a modest buildout of offshore wind after that.
As a result, our wind buildout has shrunk 28GW to 87GW by 2050 vs v3.1. This pushes up baseload power prices after 2040. It also pushes the buildout of CCS up, as we need more flexible thermal capacity to meet the shortfall.
We also now use a more conservative buildout of wind in our low scenario. This assumes that none of the floating wind projects are built.
5. IRR calculations of the battery energy storage fleet better reflect wholesale market cannibalization in buildout projections
The capacity expansion model for battery storage determines our buildout projection. Within this model, we must estimate battery revenues each year and how this changes as the fleet grows (or shrinks). This feeds into the Internal Rate of Return (IRR) calculation, which in turn determines how much storage can be built economically.
Further modeling of the cannibalization of daily price spreads (and therefore wholesale revenues) as the battery storage fleet grows, shows that as the capacity of installed batteries grows above 20GW, the spreads available start to shrink due to the actions of that fleet. We now apply this shrinkage depending on the fleet buildout - previously, we used an average across the time horizon.
So, the estimation of annual battery revenues now better accounts for the impact of this cannibalization. As a result, the buildout of storage has slowed. We forecast 54GW of utility-scale storage in 2050, which is a reduction of 6GW compared to v3.1.
6. Assume CCS plants get more economical
As the amount of abated gas (labeled as CCS) grows, we assume it new plants will require a higher hurdle rate. The first 5GW of CCS requires an IRR of 0% to be built, underpinned by government subsidy. For each GW of subsequent CCS, we require an IRR of +0.3% to make a build decision. By 2045, when there is xGW of CCS on the system, we have a hurdle rate of x%.
Now, we move on to some fairly minor changes in the dispatch model.
7. Batteries > 300MW follow ramp rate restrictions & ancillary service rules
Ramp rate restrictions apply to large generators on the GB grid: according to the grid code, they can ramp instantly to 300MW and then ramp at 50MW/minute. This is for physical notifications only.
Ancillary service contracts are also capped at 100MW for a single site.
Given the number of larger sites coming onto the system in the next few years, we can now account for these differences in custom runs for assets larger than 300MW.
Read more here.
8. Update to timelines of Open Balancing Platform updates impacting short-term BM revenues
The newly formed National Energy System Operator (NESO) recently gave an update to the Open Balancing Platform (OBP) timelines, which are detailed here.
"New Storage Parameters" going live within OBP has been pushed back from October 2024 to April 2025. This change will give control room engineers visibility of the energy capacity of batteries within the Balancing Mechanism, rather than assuming a 30-minute dispatch is possible. It is likely to increase dispatch volumes as the BM gets more efficient for storage.
As a result, we have pushed back the timelines for improving the efficiency of BM energy actions by 6 months within our BM model.
While we are starting to see some small growth in the number of system-flagged actions batteries are used for, particularly in North Scotland (more on this here), improvements to dispatch rates have been much slower for these constraint-driven actions than for energy actions. So, we have also pushed back the timelines for when we will see fully efficient system-flagged actions from 2027 to 2028.